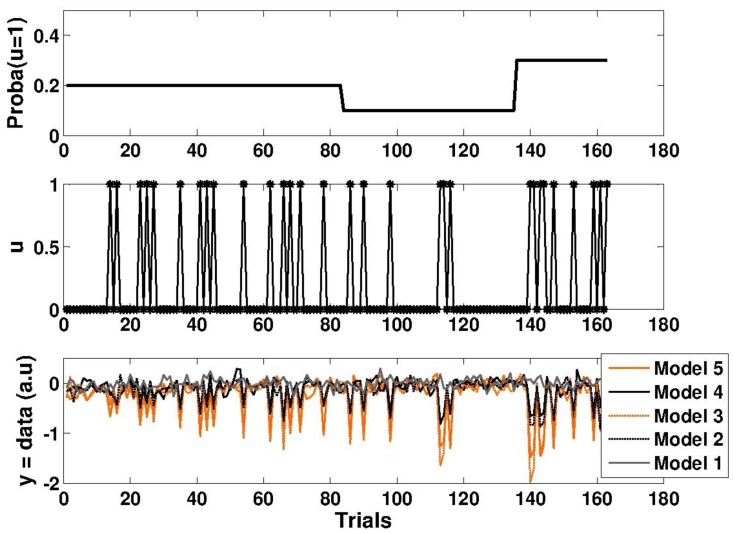
Figure 6.
Simulated data for five Bayesian learning models (defined in Table 1). (Top) The dynamics of true deviant probability. (Middle) The sequence of sensory stimuli u (0 or 1). (Bottom) The dynamics of (noisy) Bayesian surprise (simulated electroencephalography (EEG) response magnitudes over trials).

