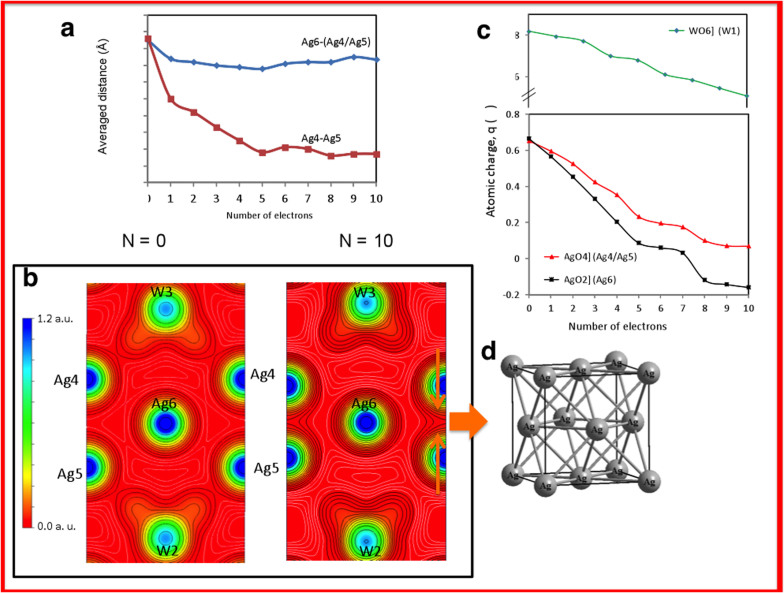
Figure 5.
(a) Average Ag-Ag distances as a function of the number of electrons added. (b) Electron density contours on the (100) plane for a neutral (N = 0) structure and a charged (N = 10) structure. Isodensity lines less than 0.02 a.u. are coloured white. (c) Charge density of the Ag and W centres in [AgO2], [AgO4], and [WO6] clusters as a function of the number of electrons added. q(Ω) represents the number of valence electrons minus the calculated charge density. (d) Structure of metallic Ag.

