Abstract
Supercapacitors that exhibit long cycle lives and fast charge/discharge rates are a promising energy-storage technology for next-generation mobile or wearable electronic systems. A great challenge facing the fabrication of ultrathin supercapacitor components, specifically their porous electrodes, is whether such components can be integrated with the fabrication of electronic devices, i.e., semiconductor fabrication processes. Here, we introduce the lithographic fabrication of micrometre-thick, submicrometre-pore-patterned carbon for supercapacitor electrodes. The pore patterns designed by multi-beam interference lithography and direct carbonisation of the photoresist pattern produced pore-patterned carbon films. A facile doping process was subsequently employed to introduce nitrogen atoms into the carbon, which was intended to further enhance the carbon's capacitive properties. Specifically, during these fabrication steps, we developed an approach that uses a supporting shell on the surface of the pore patterns to maintain their structural integrity. The nitrogen-doped, pore-patterned carbon electrodes exhibited an areal specific capacitance of 32.7 mF/cm2 at 0.5 mA/cm2 when used as supercapacitor electrodes, which is approximately 20 times greater than that of commercially available MWCNT films measured under the same conditions.
A recent striking demand of next-generation mobile electronic systems, such as wearable devices, has led to demand for ultrathin energy storage devices that can also be integrated with such systems. Supercapacitors, which are state-of-the-art energy storage devices, exhibit promising characteristics for this purpose, including high power densities (superior to that of batteries), fast charging/discharging rates (i.e., high power delivery), and long cycle lives1,2. A supercapacitor stores electrical energy electrostatically, i.e., by forming an electrochemical double layer of electrolyte ions on a charged electrode or by using an electrochemical reversible redox reaction, referred to as pseudocapacitance3. Typically, high-surface-area porous carbon materials, such as carbon nanotubes (CNTs)4, graphenes5, or mesoporous carbon particles6, have been used to achieve high supercapacitor performance. Moreover, a coating of a conducting polymer or transition-metal oxide, such as Co3O47, MnO27, V2O58, In2O39, Ni(OH)210, or Ni-Co hydroxide11 that induces the redox reaction has been used to increase the capacitance via pseudocapacitance. Specifically, RuO2-based materials exhibit excellent pseudocapacitive performance12,13,14,15. More recently, it has been demonstrated that the introduction of heteroatoms (e.g., B, N, P, and S) into carbon materials is a facile method for enhancing their pseudocapacitance16,17,18. Although metal oxide materials often exhibit low electrical conductivities, doping enables the direct control of the semiconductor properties of carbon materials and often enhances their electrical conductivity.
For the development of ultra-thin supercapacitors with sufficiently high energy and power densities, one issue is whether the fabrication of the supercapacitor and its high-specific-area electrode materials, such as porous materials, can be scaled down to the micrometer scale at the same time as the supercapacitor performance is enhanced. Recently, extensive effort has been devoted to the use of the MEMS technique for this purpose. For example, carbon-film or pattern electrodes have been fabricated via the direct carbonisation of polymer patterns defined by photolithography and printing techniques19,20,21,22. These lithography-based approaches have the additional advantage that they are compatible with the semiconductor fabrication processes used in electronic device fabrication, which enables integrated fabrication. However, their micrometre-scale features intrinsically limit their surface area, resulting in low capacitance when they are used in supercapacitor applications. Thus, recent approaches have utilised these carbon patterns of films as a substrate for the deposition of porous carbonaceous materials, such as CNTs, multilayer graphenes, and porous carbon particles, or for the deposition of pseudocapacitive materials23,24,25. However, such carbonaceous materials require multiple and different fabrication processes, which may reduce the process compatibility.
In this study, we report the lithographic fabrication of porous carbon electrodes for supercapacitor applications. Multi-beam interference lithography was used to fabricate 3D submicrometre pore-patterned thin films (only a few micrometres thick) of photoresists, and a direct carbonisation of the pattern produced the pore-patterned carbon. This 3D submicrometre pore-pattern provides a higher specific area compared to that of the previous 2D-based carbon supports because of their submicrometre and porous features. We also doped nitrogen into the carbon structure to further enhance the capacitance. The doping of heteroatoms has been widely explored in semiconductor fabrication processes to control the electronic band gap26. Specifically, in supercapacitor applications, nitrogen doping (N-doping) has been reported to generate pseudocapacitance by acting as an electron donor to attract protons or/and strengthen redox reactions27. The thin, N-doped 3D pore-patterned carbon exhibited an areal specific capacitance of 31.7 mF/cm2 when used as supercapacitor electrodes. The areal capacitance of the N-doped pore-patterned carbon was approximately 20 times greater than that of commercially available multi-walled carbon nanotube (MWCNT) electrodes. The pore-patterned carbon and our approach provide a new platform for various energy storage devices and provide a benchmark in other applications, including biosensors.
Results
Fabrication of 3D pore-patterned carbon and subsequent nitrogen doping
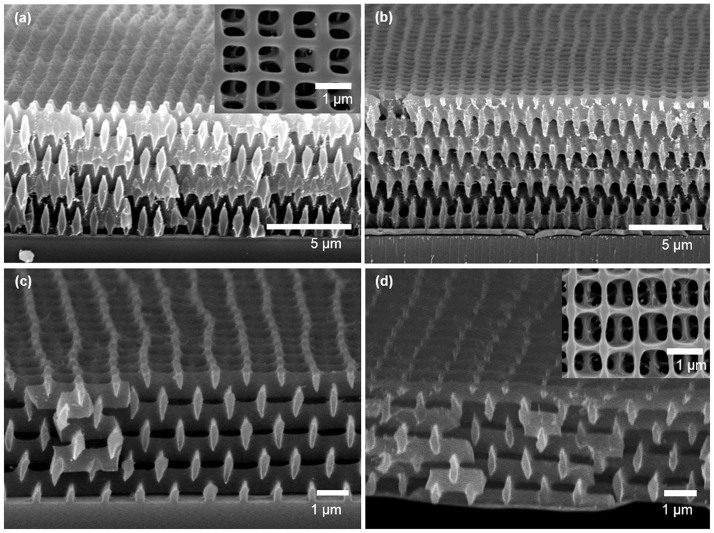
Figure 1 describes the fabrication of 3D pore-patterned carbon with N-doping. First, the 3D SU8 pore pattern was prepared by five-beam interference lithography. Briefly, five-beam overlap built up an interference pattern where the level surface at a certain intensity threshold exhibits a woodpile-like lattice. An SU8 resist was then exposed to the interference pattern. The region where the intensity of constructive interference was sufficiently high to induce crosslinking of epoxy groups of SU8 molecules was left behind after the development process (Figure 1a). Figure 2a displays the SU8 3D pore patterns, which had a surface pore size of approximately 700 nm.
Figure 1. Schematic of the fabrication of 3D N-doped pore-patterned carbon.
Figure 2. SEM image of (a) pore-patterned SU8 polymers, (b) silica-coated SU8 pore patterns, (c) carbonised silica-coated patterns, and (d) N-doped pore-patterned carbon after the silica was etched.
The insets in a) and d) are the surface images of the respective samples.
The 3D SU8 pore pattern was directly carbonised by heat treatment under an inert atmosphere at 700°C. Notably, a pyrolytic carbonisation of the SU8 pattern induced pore collapse, as shown in Figure S1, because SU8 melted above the glass-transition temperature (Tg) as the temperature was increasing during the carbonisation; the melting induced pore collapse to reduce the surface area and thereby reduce the surface energy. Thus, we utilised a silica support on the surface of the SU8 pore pattern, which resists pattern distortion and thus maintains the pore structure during the carbonisation with high fidelity (see Figure 1b). Here, the silica coating was deposited via atmospheric pressure chemical vapour deposition (CVD), and the typical coating thickness was approximately 20 nm28. Figure 2b presents the silica-coated SU8 pore pattern (the presence of the silica is evident in the energy-dispersive spectroscopy (EDS) analysis results in Table S1). Figure 2c displays a SEM image of the silica-coated SU8 pore pattern after the carbonisation process as described in Figure 1c. The film thickness was decreased by 60% due to the mass loss of volatile moieties during the carbonisation process. However, the surface pore size was nearly maintained because the SU8 film was adhered onto the substrate.
Then, N-doping was achieved via heat treatment in the presence of melamine (1,3,5-triazine-2,4,6-triamine) as described in Figure 1d. Doping using melamine as a solid-phase nitrogen source has been reported to occur via the following mechanism. At a temperature in the range of 300–500°C, melamine molecules were sublimed and absorbed onto a carbon surface and subsequently condensed to carbon nitrides. At temperatures greater than 600°C, the resulting carbon nitrides decomposed and the nitrogen diffused into the carbon layers29. Notably, the silica shell support is also required to maintain the 3D pore-patterned structure during the doping. As evident from the results in Figure S2, doping in the absence of the silica support impaired the structural integrity of the substrate because the doping was achieved with simultaneous destruction of the carbon crystallites, which may also change the bulk morphology. Figure 2d presents a SEM image of the 3D pore-patterned carbon obtained by heat treatment in the presence of melamine. Here, the silica shell was removed by a diluted HF solution, which was confirmed by EDS analysis (Table S1).
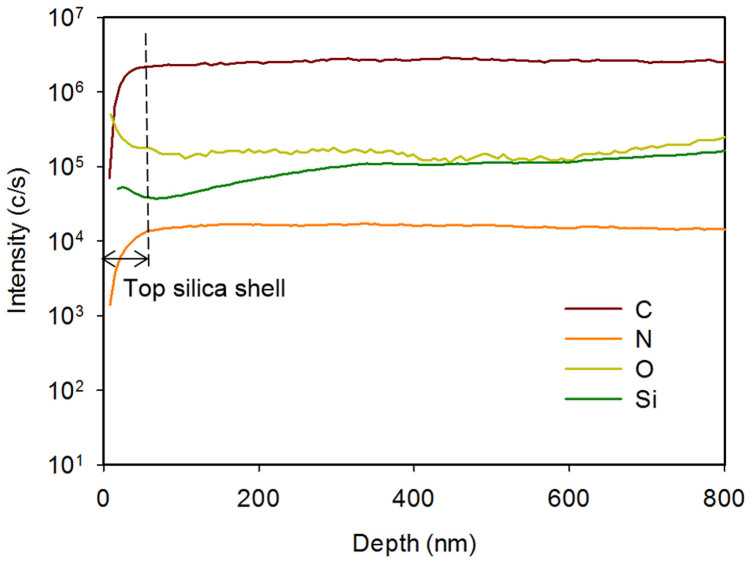
We sought to determine whether the doping could be achieved with the silica shell intact. To confirm the N-doping and its distribution from the surface of the carbon, we characterised the distribution of the chemical compositions of silica-coated 3D pore-patterned carbon along the depth from the surface by secondary-ion mass spectrometry (SIMS), as shown in Figure 3. Here, the depth range of 0–800 nm from the surface includes the first layer of the 3D woodpile lattice. At depths to 100 nm, the intensity of the peaks associated with Si and O decreased, whereas those associated with C and N atoms increased rapidly. The intensities of the peaks associated with C, Si, and O were maintained at depths up to 800 nm, which indicates the depth of the first carbon layer in the lattice where its side wall is uniformly coated by the silica layer. In the case of nitrogen, the peak intensity was concurrent with that of carbon and maintained the same level throughout the depth to 800 nm from the surface. This result clearly indicates that N-doping was achieved underneath the silica shell and that the doping concentration was uniform over the carbon layer.
Figure 3. SIMS profile of the N-doped pore-patterned carbon with a silica shell.
Control and characterisation of N-doping
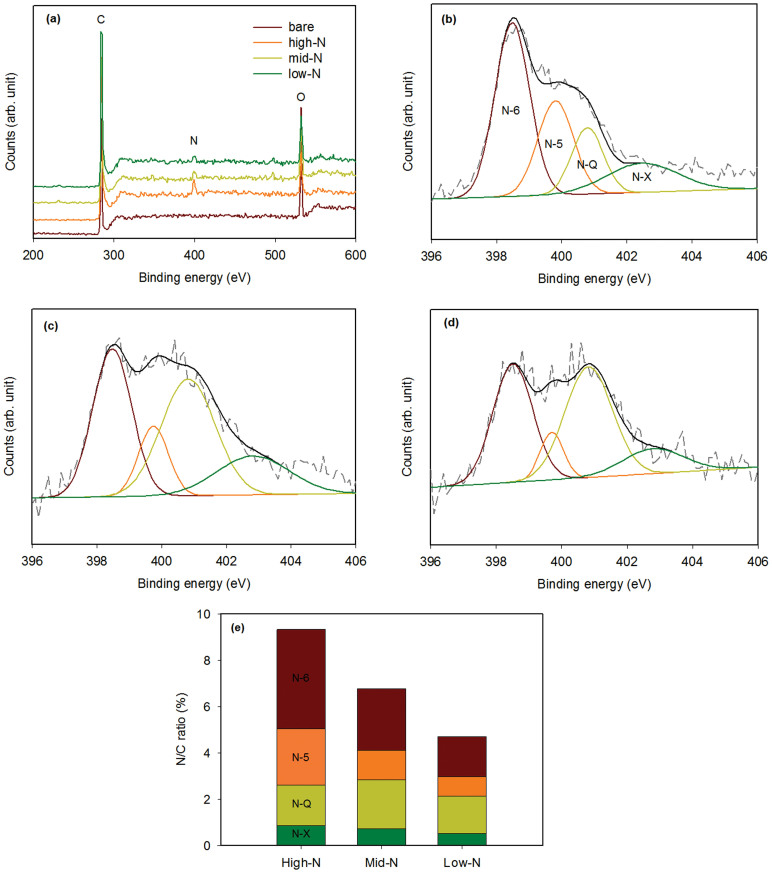
Here, the N-doping concentration was controlled by the melamine treatment temperature. Figures 4a, b, and c display the 3D N-doped pore-patterned carbon obtained at 700, 900, and 1,000°C, respectively. The doping concentration was estimated by X-ray photoelectron spectroscopy (XPS). In the XPS survey spectra shown in Figure 5a, the nitrogen content was estimated to be approximately 9.33, 6.73, and 4.70% greater than the carbon content for the samples doped at 700, 900, and 1,000°C, respectively, whereas no nitrogen was detected in the pristine sample (Table S2). Thus, the nitrogen content was observed to decrease with increasing doping temperature. Nitrogen has been reported to preferentially dope at active sites in carbon lattices, such as at a dangling bond or at an edge of a graphitic plane30,31. The content of active sites may be decreased when the crystalline carbon is grown at higher doping temperatures29. Moreover, the nitrogen groups could be desorbed at higher temperatures because of their lower binding energy, which would explain the lower N-doping at higher temperatures29.
Figure 4. SEM image of N-doped pore-patterned carbon films prepared at doping temperatures of (a) 700°C, (b) 900°C, and (c) 1,000°C.
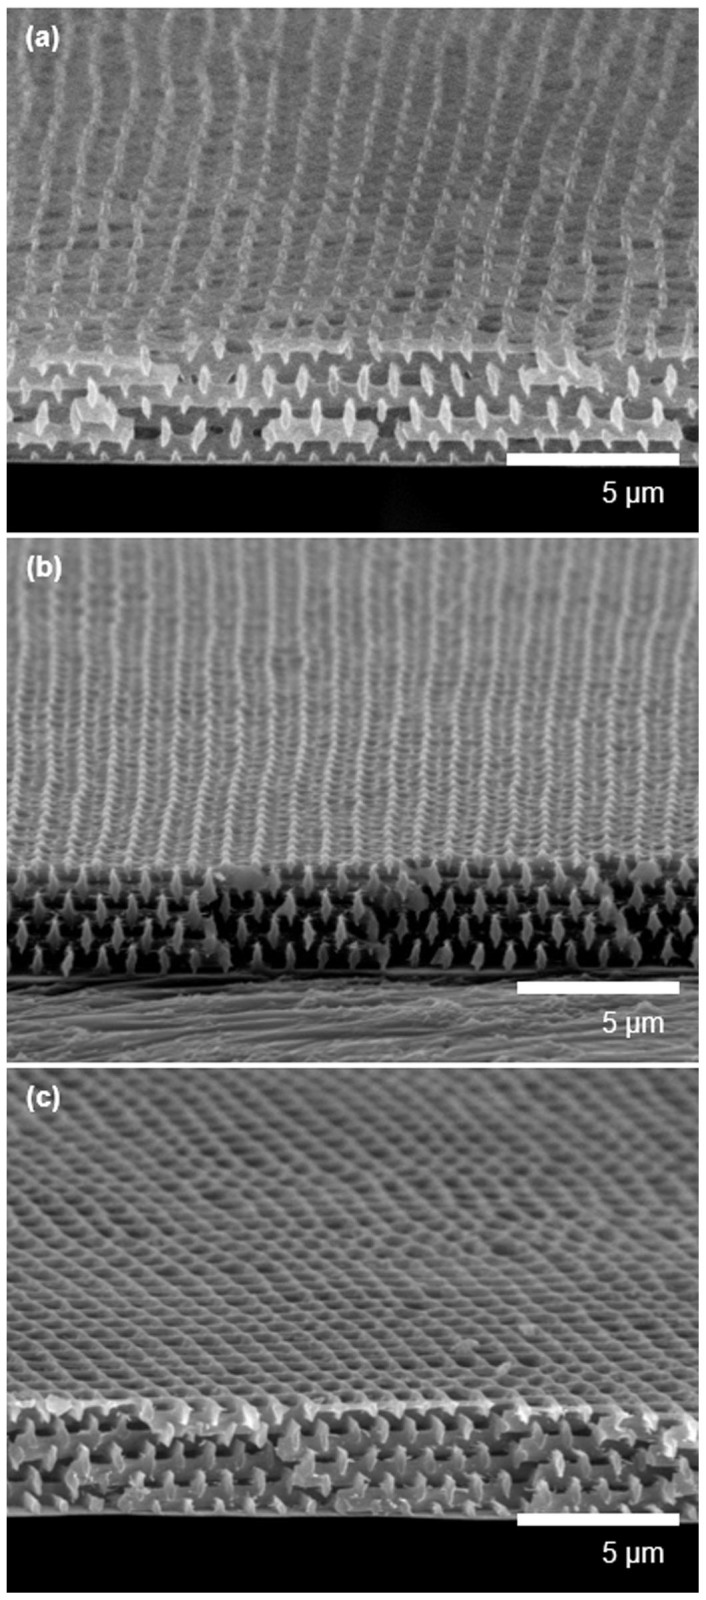
Figure 5.
(a) XPS survey spectra of the N-doped samples prepared at various doping temperatures. The N 1s XPS spectrum (dotted gray line) of the N-doped samples prepared at (b) 700°C, (c) 900°C, and (d) 1,000°C. The deconvoluted peaks of N-6, N-5, N-Q, and N-X (coloured lines) and their fitted curves (solid black line) are also designated in each spectrum. (e) The N/C composition ratio for the N-doped samples prepared at various doping temperatures.
The N 1s XPS spectra were used to characterise the doping configuration of nitrogen in the samples prepared at various temperatures; Figures 5b, c, and d display the spectra of the N-doped pore-patterned carbon prepared at 700, 900, and 1,000°C, respectively. We deconvoluted the peaks in these N 1s spectra into four peaks at 398.5, 399.8, 400.8, and 402.8 eV to identify the functionalities of the doped nitrogen. The peaks with low binding energies were attributed to pyridinic nitrogen, where the N atom has an sp2 hybridisation with two carbon atoms (N-6), and to pyrrolic nitrogen, where the nitrogen atom is incorporated into a five-membered ring of carbon atoms (N-5). The peak at 400.7–400.8 eV designates quaternary nitrogen (N-Q) that substitute carbon atoms in graphene layers and is thereby sp3 hybridised with three carbon atoms22,23. The peak at 402.5–402.6 eV was attributed to pyridine oxide or oxidised nitrogen (N-X) groups32,33. The content ratio of these nitrogen configurations was obtained through comparison of the peak area of each configuration; the results are summarised in Figure 5e. The pore-patterned carbon prepared at 700°C (i.e., with a high N-doping concentration) possesses dominant N-6 and N-5 configurations, whereas the intensity of these configurations decreased in the case of pore-patterned carbon prepared at higher temperatures (i.e., with a lower N-doping concentration). Concurrently, a higher N-Q configuration was observed with increasing doping temperature. It has been reported that the N-Q configuration possessed a higher binding energy than the other configurations and thus, the N-Q configuration was stable and preferentially formed at higher temperatures34,35.
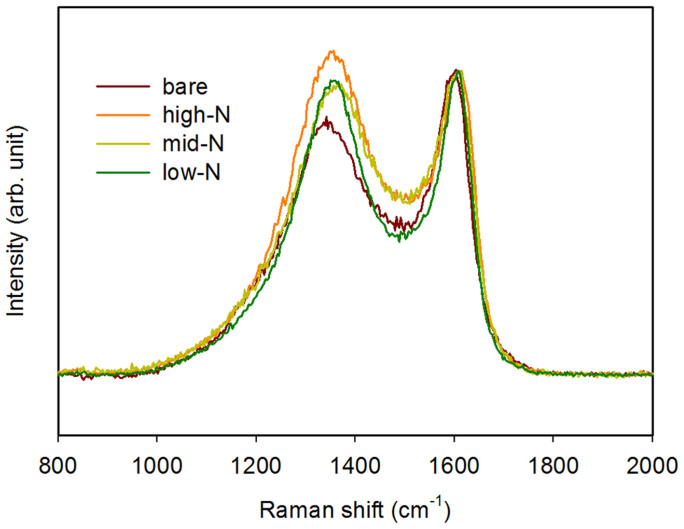
Meanwhile, the crystallinity of the N-doped carbon as well as the effect of N-doping on the carbon crystallinity was investigated by Raman spectroscopy, as shown in Figure 6. The Raman spectra exhibit two clear peaks at approximately 1,350 and 1,580 cm−1, which correspond to the disordered (D) band and graphitic (G) band, respectively. The D band arises from a breathing mode of κ-point photons of A1g symmetry, which is related to the disorder or defects in the graphitic structure36. The G band is attributed to an E2g mode related to the vibration in all sp2-bonded carbon atoms in a two-dimensional hexagonal lattice and is thus related to the graphitic structure37. The intensity ratio between the D and G bands (ID/IG) is inversely proportional to the domain size of in-plain graphitic crystallites38. Compared to the bare pore-patterned carbon, N-doping substantially increased the D band, i.e., ID/IG value. The ID/IG value for the N-doped pore-patterned carbon was 1.06, 0.96, and 0.94 prepared at 700, 900, and 1,000°C, respectively; the N-doped pore-patterned carbons prepared at higher doping temperatures exhibited lower ID/IG ratios, indicating that the defective graphitic layer was recovered with increasing N-doping temperature. These results corroborate the XPS results.
Figure 6. Raman spectra of N-doped pore-patterned carbon samples prepared at various doping temperatures.
The spectra of pristine pore-patterned carbon are also shown.
Electrochemical properties and supercapacitance performance of N-doped pore-patterned carbon
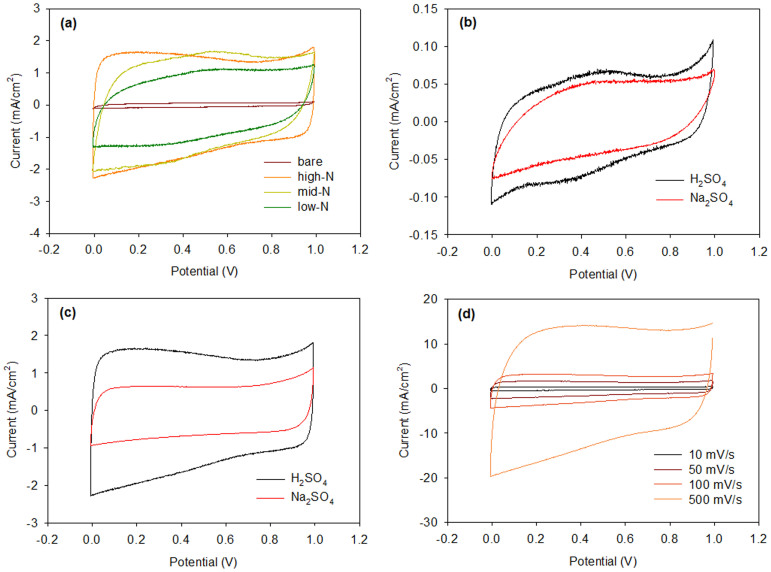
Cyclic voltammetry (CV) measurements were performed to determine the electrochemical properties of the N-doped pore-patterned carbons prepared at various N-doping temperatures. Here, using a three-electrode cell and 1.0 M H2SO4 solution, we measured the current density in the potential range of 0–1 V vs. Ag/AgCl. Figure 7a presents the CV curves for N-doped pore-patterned carbons prepared at various doping temperatures. The bare pore-patterned carbon was also measured for comparison. First, we observed quasi-rectangular CV curves with a broad hump, especially in the CVs of the samples prepared at 900 and 1,000°C; these curves indicate the combination of electric double-layer (EDL) capacitance and pseudocapacitance. Because the peak position is similar to that in the CV of the bare pore-patterned carbon, the oxygenated groups on the carbon surface and their quinone/hydroquinone reaction may be involved in this pseudocapacitance32,39. As shown in Figure 7a, the CV curves of the N-doped pore-patterned carbon prepared at lower temperature (i.e., with a higher nitrogen content) indicate a higher current density over the potential range and a less pronounced peak at approximately 0.5 V. Because a higher current density over the voltage window (i.e., a large enclosed area in the CV) corresponds to higher capacitance, this result reveals that N-doping increases the capacitance.
Figure 7.
(a) CV curves measured at 50 mV/s for the N-doped pore-patterned carbon samples prepared at various doping temperatures. The CV curves of pristine pore-patterned carbon are also shown. CV curves of (b) the pristine carbon, and (c) the N-doped carbon samples measured using 1 M H2SO4 and 1 M Na2SO4 electrolyte solutions. (d) CV curves of the N-doped carbon samples (700°C) at various scan rates from 10 to 500 mV/s in 1 M H2SO4.
To evaluate the degree to which capacitive mechanism increased the capacitance, the CV curves measured using H2SO4 and Na2SO4 electrolyte solutions were compared for the bare and N-doped pore-patterned carbons, as shown in Figures 7b and 7c. The neutral electrolyte solution contains balanced numbers of hydrogen and hydroxide ions; thus, the CV spectrum reflects the EDL capacitance. It has been shown that the pseudo-faradaic reaction induced by O- and N-containing electroactive surface groups is depressed in neutral electrolyte solutions when compared to the reaction in H2SO4 electrolyte solution39,40. The N-doped pore-patterned carbon exhibits a greater difference in the CV area between these electrolyte solutions compared to the bare pore-patterned carbon, indicating that N-doping substantially increased the pseudocapacitance. The incorporation of nitrogen has been reported to improve the charge mobility in a carbon matrix by introducing electron-donor characteristics and/or by attracting protons, which facilitates the redox reaction involving nitrogen or a neighbouring functional group17,41. Figure 7d presents the CV curves of highly N-doped pore-patterned carbon at various scan rates of 0.01–0.5 V/s. The rectangular shape of the CV curves is maintained, even at a potential scan rate of 500 mV/s, whereas the CV curves of the bare carbon become distorted with increasing scan rate (see Figure S3). The good rate capability of the N-doped pore-patterned carbon confirms its highly reversible pseudocapacitance.
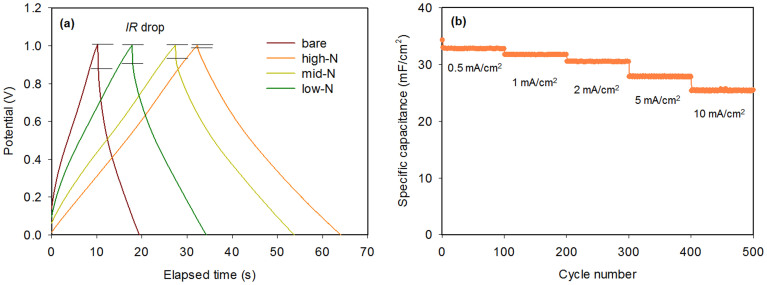
Finally, galvanostatic charge/discharge measurements were conducted to characterise the performance of N-doped pore-patterned carbon as supercapacitor electrodes. The measurement was performed at various current densities and with voltage windows of 0–1 V. The surface area of each 3D pore-patterned carbon was measured to calculate the specific capacitance per pattern area. The specific capacitance can be derived using the following equation42:
 |
where I is the applied working current, Δt is the discharge time, ΔV is the voltage range, and A is the total electrode area. As shown in Figure 8a, the specific capacitance of highly N-doped pore-patterned carbon is 31.7 mF/cm2 at a current density of 1 mA/cm2, which is 2.4 times greater than that of bare 3D pore-patterned carbon (9.2 mF/cm2). The high specific capacitance is also associated with a lower decrease in the IR of the high-N sample (shown in Figure 8a), which is only 18 mV at 1 mA/cm2, whereas that of the bare carbon pattern is 170 mV at the same current density. It have been often reported this decrease in the IR drop; it is induced by the increased electrical conductivity of the carbon, which results in N-doping43. The galvanostatic charge/discharge at various current densities of 0.5–10 mA/cm2 is shown in Figure 8b. The highest specific capacitance was 32.7 mF/cm2 at 0.5 mA/cm2, and an areal specific capacitance greater than 25 mF/cm2 was observed at a current density of 10 mA/cm2. The N-doped pore-patterned carbons maintained their capacitance at 77% of the capacitance at 0.5 mA/cm2, even the current density was increased by 20-fold. Furthermore, we have tested the cycle stability; Figure S4 shows the variation with cycle number of the capacitance of the high-N-doped pore-patterned carbon at a current density of 1 mA/cm2. The capacitance retention remains within 10% of the initial capacitance after 20000 cycles, which demonstrates the good cycle stability of N-doped pore-patterned carbon as a supercapacitive electrode material.
Figure 8.
(a) Galvanostatic charge/discharge curves of the pristine and N-doped pore-patterned carbons at a current density of 1 mA/cm2. (b) The specific capacitance of N-doped pore-patterned carbon (sample prepared at 700°C) at various current densities.
We compared the capacitance of the N-doped pore-patterned carbon with that of films prepared using commercially available MWCNTs15,44. Here, the specific capacitance of the MWCNTs was measured to be 86 F/g as shown in Figure S5, which is similar to the values reported in the literature45,46. To directly compare the capacitance with the N-doped pore-patterned carbon, the specific capacitance of the MWCNTs were converted to areal capacitance using the reported density of MWCNTs, 0.20–0.30 g/cm3, and the thickness; the areal capacitance of the MWCNTs was estimated to be 1.4 mF/cm2 at a current density of 0.68 mA/cm2. Notably, the areal capacitance of the N-doped pore-patterned carbon at a similar current density of 0.5 mA/cm2 was approximately 20 times greater than that of the MWCNTs, as described in Figure S5.
Discussion
Energy storage devices for integration with next-generation mobile or wearable devices require thin-film devices; however, this application may limit the fabrication of such energy storage devices so that they are compatible with semiconductor fabrication processes. We fabricated a porous carbon-based supercapacitor electrode via semiconductor fabrication processes, i.e., photolithography and a doping process. Specifically, multi-beam interference lithography was used to prepare submicrometre 3D pore-patterned polymers, and a pyrolytic carbonisation of the 3D pore patterns and subsequent high-temperature doping process produced 3D N-doped, pore-patterned carbon with a few micrometre thickness. In contrast to the previous approach, where lithographically defined 2D or quasi-3D carbon patterns only act as a support to deposit porous materials, our approach employed 3D submicrometre pore patterns as an electrode structure. During these carbonisation and doping steps, a silica support coated onto the pore pattern was employed, and this support was critical to achieving N-doping with structural integrity of the 3D pore patterns as well as to obtaining the pore-patterned carbon via the carbonisation process. Uniform N-doping in the carbon matrix could be achieved even when the silica shell was deposited onto the pore pattern. In this study, we controlled the N-doping concentration via the heat treatment temperature with melamine as a nitrogen source; the nitrogen concentration decreased with increasing temperature. In-depth characterisation of the doping configuration indicated that, similar to the previously reported results for doping in graphenes, the doping into the SU8-derived carbon at higher temperatures also produced a higher proportion of quaternary nitrogen that is stable at higher temperatures because of its higher binding energy. Using electrochemical characterisation, the N-doping was observed to enhance the pseudocapacitance and rate capability of the pseudocapacitance. When evaluated as a supercapacitor electrode, the N-doped pore-patterned carbon displayed an areal specific capacitance as high as 32.7 mF/cm2, which is approximately 20 times greater than that of commercial MWCNT films prepared and tested under the same conditions. Furthermore, the capacitance was maintained at 77% when the current density was increased 20-fold. This highly stable capacitance over a wide range of current densities can be attributed to the fact that the pore-patterned, fully connected structure facilitates both charge transport through the connected carbon matrix and ion diffusion through the pore networks. Our pore-patterned carbonaceous materials will find various applications, ranging from electrochemical and electrocatalytic electrodes to biosensors based on lab-on-a-chip technology. Future experiments may include the multiscale patterning of the pore-patterned structures using various photolithography or printing techniques, which would enable electrode architecting for ultrathin microsupercapacitors.
Methods
Preparation of the 3D pore pattern via multi-beam interference lithography
The interference pattern was produced by passing the laser beam (532 nm wavelength, Nd:YVO4, Coherent) through a top-cut four-sided silica prism. The beam expanded by a factor of 10 using a Galilean beam expander (Thorlabs), directed onto the top surface and the four beams directed to the prism sides possess the wavevectors of k0 = k(0, 0, 1), k1 = k(−sinθ, 0, cosθ), k2 = k(0, −sinθ, cosθ), k3 = k(sinθ, 0, cosθ) and k4 = k(0, sinθ, cosθ), where k = 2π/λ, λ is the wavelength of the laser beam (532 nm), and θ is the angle between the side beams and central beam (30°). The polarisations of all beams were aligned along the diagonal of the square top surface. The iso-intensity level surface of the interference pattern of these five beams is described in the Figure 1a. The photoresist was prepared by dissolving 10 wt% of SU8 (Miller-Stephenson Chemical) in γ-butyrolactone (Sigma-Aldrich) and then adding 2 wt% of a cationic photoinitiator, (5-cyclopentadienyl) (6-isopropylbenzene) iron hexafluorophosphate (Irgacure 261, BASF), over the SU8. The photoresist solution was spin-coated at 1,000 rpm and subsequently soft-baked at 95°C for 10 min, resulting in a photoresist film with a thickness of 7–9 μm. The interference pattern was exposed onto the photoresist film, which was subsequently baked at 65°C for 5 min and then 95°C for 5 min. The pattern development was achieved by soaking the exposed film in propylene glycol methyl ether acetate (Sigma-Aldrich).
Carbonisation of the 3D pore patterns and N-doping
The SU8 pore patterns were coated with a silica shell prior to pyrolytic carbonisation and high-temperature N-doping. The silica shell was deposited by room-temperature chemical vapour deposition (CVD); the pattern was alternatively exposed to water vapour (RH 60%) and SiCl4 (Aldrich) precursor vapour, and the thickness was controlled via the exposure cycles. The silica-shell-coated 3D SU8 pore patterns were carbonised in a quartz tube furnace under an Ar atmosphere at 700°C for 3 h with heating rate of 4°C/min. Subsequently, the N-doping was achieved by heat treatment of the silica-shell-coated 3D pore-patterned carbon in the presence of 1,3,5-triazine-2,4,6-triamine (melamine). Specifically, the sample was neighboured with melamine powder and heat-treated at 700, 900, or 1,000°C for 1 h with a heating rate of 5°C/min under an Ar atmosphere. The silica shell was removed with a dilute HF solution (5 v/v%).
Characterisation
The surface morphologies of 3D patterns were measured by SEM (Hitachi) and the thickness of the SU-8 patterns was measured in the cross-sectional SEM images. The composition of pattern before and after the removal of silica-coating was evaluated using an energy-dispersive spectroscopy (EDX) attached to the SEM (JEOL). The Raman spectra were collected using a Horiba Jobin Yvon LabRAM HR equipped with an air-cooled Ar-ion laser operated at 541 nm. The composition analysis was carried out by CAMECA IMS-6f Magnetic Sector SIMS equipment with Cs+ primary ion beam for sputtering. The depth profiles of the films were obtained using impact energy of 5 keV with current of 50 nA. The cluster ions such as CsX+ (X = C, N, O, and Si) were monitored for the depth profile. The elemental composition and bonding nature of N-doped 3D pattern were determined by X-ray photoelectron spectroscopy (XPS). XPS was performed using a Leybold spectrometer equipped with an Al Kα monochromatic radiation source (1,486.6 eV) with an input power of 150 W (ESCALAB250 XPS system, Theta Probe XPS system).
Electrochemical measurements
A three-electrode system was used to measure the electrochemical properties; the three-electrode cell was assembled with 3D pore-patterned carbon on a glassy electrode as a working electrode, an Ag/AgCl as the reference electrode, and a Pt rod as the counter electrode. Specifically, the working electrode was prepared by casting 1 wt% PVdF onto the glassy carbon as a binder. The 3D pore-patterned carbon was subsequently attached onto the glassy carbon and placed in a convection oven until the sample was dried. The working electrode was then immersed in the electrolyte solution for the measurement. A 1.0 M H2SO4 (Aldrich) or 1.0 M Na2SO4 (Aldrich) solution was used as the electrolyte solution. Cyclic voltammetry (CV) and galvanostatic charge–discharge cycles were measured using a VersaSTAT 3 (AMETEK). CV was performed over the voltage range of 0 to 1 V vs. Ag/AgCl at scan rates of 0.01–0.5 V/s. In the galvanostatic charge–discharge measurements, the cell was prepared with a voltage of 0–1 V by applying various current densities of 0.5–10 mA/cm2.
Author Contributions
D.K. designed and conducted the experiments. J.H.M. supervised the experiments. D.K. and J.H.M. contributed to the interpretation of the data and wrote the article.
Supplementary Material
supplementary information
Acknowledgments
This work was supported by grants from Samsung Research Funding Center (SRFC-MA1401-08) and National Research Foundation of Korea (NRF) (2012M1A2A2671794).
References
- Simon P. & Gogotsi Y. Materials for electrochemical capacitors. Nat. Mater. 7, 845–854 (2008). [DOI] [PubMed] [Google Scholar]
- Zhang L. L. & Zhao X. S. Carbon-based materials as supercapacitor electrodes. Chem. Soc. Rev. 38, 2520–2531 (2009). [DOI] [PubMed] [Google Scholar]
- Conway B. E. Electrochemical Supercapacitors: Scientific Fundamentals and Technological Applications (Springer, 1999). [Google Scholar]
- Zhao L. et al. Nitrogen-Containing Hydrothermal Carbons with Superior Performance in Supercapacitors. Adv. Mater. 22, 5202–5206 (2010). [DOI] [PubMed] [Google Scholar]
- Stoller M. D., Park S., Zhu Y., An J. & Ruoff R. S. Graphene-Based Ultracapacitors. Nano Lett. 8, 3498–3502 (2008). [DOI] [PubMed] [Google Scholar]
- Xing W. et al. Superior electric double layer capacitors using ordered mesoporous carbons. Carbon 44, 216–224 (2006). [Google Scholar]
- Meher S. K. & Rao G. R. Effect of Microwave on the Nanowire Morphology, Optical, Magnetic, and Pseudocapacitance Behavior of Co3O4. J. Phys. Chem. C 115, 25543–25556 (2011). [Google Scholar]
- Perera S. D. et al. Vanadium Oxide Nanowire–Carbon Nanotube Binder-Free Flexible Electrodes for Supercapacitors. Adv. Energy Mater. 1, 936–945 (2011). [Google Scholar]
- Bastakoti B. P. et al. Mesoporous Carbon Incorporated with In2O3 Nanoparticles as High-Performance Supercapacitors. Eur. J. Inorg. Chem. 2013, 1109–1112 (2013). [Google Scholar]
- Wang Y.-M., Zhao D.-D., Zhao Y.-Q., Xu C.-L. & Li H.-L. Effect of electrodeposition temperature on the electrochemical performance of a Ni(OH)2 electrode. RSC Advances 2, 1074–1082 (2012). [Google Scholar]
- Bastakoti B. P. et al. Hydrothermal Synthesis of Binary Ni–Co Hydroxides and Carbonate Hydroxides as Pseudosupercapacitors. Eur. J. Inorg. Chem. 2013, 39–43 (2013). [Google Scholar]
- Liu X. R., Huber T. A., Kopac M. C. & Pickup P. G. Ru oxide/carbon nanotube composites for supercapacitors prepared by spontaneous reduction of Ru(VI) and Ru(VII). Electrochim. Acta 54, 7141–7147 (2009). [Google Scholar]
- Wu Z.-S. et al. Anchoring Hydrous RuO2 on Graphene Sheets for High-Performance Electrochemical Capacitors. Adv. Funct. Mater. 20, 3595–3602 (2010). [Google Scholar]
- Huang H.-S. et al. Evaporation-Induced Coating of Hydrous Ruthenium Oxide on Mesoporous Silica Nanoparticles to Develop High-Performance Supercapacitors. Small 9, 2520–2526 (2013). [DOI] [PubMed] [Google Scholar]
- Das R. K., Liu B., Reynolds J. R. & Rinzler A. G. Engineered Macroporosity in Single-Wall Carbon Nanotube Films. Nano Lett. 9, 677–683 (2009). [DOI] [PubMed] [Google Scholar]
- Wang D.-W., Li F., Chen Z.-G., Lu G. Q. & Cheng H.-M. Synthesis and electrochemical property of boron-doped mesoporous carbon in supercapacitor. Chem. Mater. 20, 7195–7200 (2008). [Google Scholar]
- Chen L.-F. et al. Synthesis of Nitrogen-Doped Porous Carbon Nanofibers as an Efficient Electrode Material for Supercapacitors. ACS Nano 6, 7092–7102 (2012). [DOI] [PubMed] [Google Scholar]
- Paraknowitsch J. P. & Thomas A. Doping carbons beyond nitrogen: an overview of advanced heteroatom doped carbons with boron, sulphur and phosphorus for energy applications. Energy Environ. Sci. 6, 2839–2855 (2013). [Google Scholar]
- Hsia B., Kim M. S., Vincent M., Carraro C. & Maboudian R. Photoresist-derived porous carbon for on-chip micro-supercapacitors. Carbon 57, 395–400 (2013). [Google Scholar]
- Xiao X. et al. Increased Mass Transport at Lithographically Defined 3-D Porous Carbon Electrodes. ACS Appl. Mater. Interfaces 2, 3179–3184 (2010). [DOI] [PubMed] [Google Scholar]
- Ghosh A., Le V. T., Bae J. J. & Lee Y. H. TLM-PSD model for optimization of energy and power density of vertically aligned carbon nanotube supercapacitor. Sci. Rep. 3, 2939; 10.1038/srep02939 (2013). [DOI] [PMC free article] [PubMed] [Google Scholar]
- Wang Z.-L., Guo R., Ding L.-X., Tong Y.-X. & Li G.-R. Controllable Template-Assisted Electrodeposition of Single-and Multi-Walled Nanotube Arrays for Electrochemical Energy Storage. Sci. Rep. 3, 1204; 10.1038/srep01204 (2013). [DOI] [PMC free article] [PubMed] [Google Scholar]
- Xiao F. et al. Coating Graphene Paper with 2D-Assembly of Electrocatalytic Nanoparticles: A Modular Approach toward High-Performance Flexible Electrodes. ACS Nano 6, 100–110 (2011). [DOI] [PubMed] [Google Scholar]
- Zhang L. L., Gu Y. & Zhao X. Advanced porous carbon electrodes for electrochemical capacitors. J. Mater. Chem. A 1, 9395–9408 (2013). [Google Scholar]
- Lee S.-W. et al. Structural Changes in Reduced Graphene Oxide upon MnO2 Deposition by the Redox Reaction between Carbon and Permanganate Ions. J. Phys. Chem. C 118, 2834–2843 (2014). [Google Scholar]
- Wiggins-Camacho J. D. & Stevenson K. J. Effect of nitrogen concentration on capacitance, density of states, electronic conductivity, and morphology of N-doped carbon nanotube electrodes. J. Phys. Chem. C 113, 19082–19090 (2009). [Google Scholar]
- Wang H., Maiyalagan T. & Wang X. Review on recent progress in nitrogen-doped graphene: synthesis, characterization, and its potential applications. ACS Catal. 2, 781–794 (2012). [Google Scholar]
- Jin W.-M. & Moon J. H. Supported pyrolysis for lithographically defined 3D carbon microstructures. J. Mater. Chem. 21, 14456–14460 (2011). [Google Scholar]
- Sheng Z.-H. et al. Catalyst-free synthesis of nitrogen-doped graphene via thermal annealing graphite oxide with melamine and its excellent electrocatalysis. ACS Nano 5, 4350–4358 (2011). [DOI] [PubMed] [Google Scholar]
- Xu B., Hou S., Cao G., Wu F. & Yang Y. Sustainable nitrogen-doped porous carbon with high surface areas prepared from gelatin for supercapacitors. J. Mater. Chem. 22, 19088–19093 (2012). [Google Scholar]
- Zhang L. L. et al. Nitrogen doping of graphene and its effect on quantum capacitance, and a new insight on the enhanced capacitance of N-doped carbon. Energy Environ. Sci. 5, 9618–9625 (2012). [Google Scholar]
- Hulicova-Jurcakova D., Seredych M., Lu G. Q. & Bandosz T. J. Combined Effect of Nitrogen- and Oxygen-Containing Functional Groups of Microporous Activated Carbon on its Electrochemical Performance in Supercapacitors. Adv. Funct. Mater. 19, 438–447 (2009). [Google Scholar]
- Yang X., Wu D., Chen X. & Fu R. Nitrogen-Enriched Nanocarbons with a 3-D Continuous Mesopore Structure from Polyacrylonitrile for Supercapacitor Application. J. Phys. Chem. C 114, 8581–8586 (2010). [Google Scholar]
- Su F. et al. Nitrogen-containing microporous carbon nanospheres with improved capacitive properties. Energy Environ. Sci. 4, 717–724 (2011). [Google Scholar]
- Li X. et al. Simultaneous nitrogen doping and reduction of graphene oxide. J. Am. Chem. Soc. 131, 15939–15944 (2009). [DOI] [PubMed] [Google Scholar]
- Qian Y., Wang C. & Le Z.-G. Decorating graphene sheets with Pt nanoparticles using sodium citrate as reductant. Appl. Surf. Sci. 257, 10758–10762 (2011). [Google Scholar]
- Kudin K. N. et al. Raman spectra of graphite oxide and functionalized graphene sheets. Nano Lett. 8, 36–41 (2008). [DOI] [PubMed] [Google Scholar]
- Cancado L. et al. General equation for the determination of the crystallite size L a of nanographite by Raman spectroscopy. Appl. Phys. Lett. 88, 163106–163106-163103 (2006). [Google Scholar]
- Raymundo-Piñero E., Leroux F. & Béguin F. A high-performance carbon for supercapacitors obtained by carbonization of a seaweed biopolymer. Adv. Mater. 18, 1877–1882 (2006). [Google Scholar]
- Wu F.-C., Tseng R.-L., Hu C.-C. & Wang C.-C. Effects of pore structure and electrolyte on the capacitive characteristics of steam- and KOH-activated carbons for supercapacitors. J. Power Sources 144, 302–309 (2005). [Google Scholar]
- Sun L. et al. Nitrogen-doped graphene with high nitrogen level via a one-step hydrothermal reaction of graphene oxide with urea for superior capacitive energy storage. RSC Advances 2, 4498–4506 (2012). [Google Scholar]
- Moon G. D., Joo J. B., Dahl M., Jung H. & Yin Y. Nitridation and Layered Assembly of Hollow TiO2 Shells for Electrochemical Energy Storage. Adv. Funct. Mater. 24, 848–856 (2014). [Google Scholar]
- Yuan L. et al. Flexible solid-state supercapacitors based on carbon nanoparticles/MnO2 nanorods hybrid structure. ACS Nano 6, 656–661 (2011). [DOI] [PubMed] [Google Scholar]
- Balach J., Bruno M. M., Cotella N. G., Acevedo D. F. & Barbero C. A. Electrostatic self-assembly of hierarchical porous carbon microparticles. J. Power Sources 199, 386–394 (2012). [Google Scholar]
- Frackowiak E., Metenier K., Bertagna V. & Beguin F. Supercapacitor electrodes from multiwalled carbon nanotubes. Appl. Phys. Lett. 77, 2421–2423 (2000). [Google Scholar]
- Pandolfo A. & Hollenkamp A. Carbon properties and their role in supercapacitors. J. Power Sources 157, 11–27 (2006). [Google Scholar]
Associated Data
This section collects any data citations, data availability statements, or supplementary materials included in this article.
Supplementary Materials
supplementary information


