Abstract
A quasi-Poisson generalized linear model combined with a distributed lag non-linear model was used to quantify the main effect of temperature on emergency department visits (EDVs) for childhood diarrhea in Brisbane from 2001 to 2010. Residual of the model was checked to examine whether there was an added effect due to heat waves. The change over time in temperature-diarrhea relation was also assessed. Both low and high temperatures had significant impact on childhood diarrhea. Heat waves had an added effect on childhood diarrhea, and this effect increased with intensity and duration of heat waves. There was a decreasing trend in the main effect of heat on childhood diarrhea in Brisbane across the study period. Brisbane children appeared to have gradually adapted to mild heat, but they are still very sensitive to persistent extreme heat. Development of future heat alert systems should take the change in temperature-diarrhea relation over time into account.
Climate change has impacted and will increasingly influence human health, especially in the context of rapid globalization1. Children are particularly vulnerable to climate change impact2. They may experience greater risk of infectious diseases (e.g., diarrhea) as global surface average temperature increases3.
Prior studies have well documented that heat waves may increase morbidity and mortality4,5. Some researchers have argued that the impact of heat waves on human health may be due to both the independent effects of daily high temperature (main effect) and of persistent periods of heat (added effect)4,6,7. As climate change continues, there will be more frequent, more intense and longer-lasting heat waves8. Food chain, from food preparation stage to production process, may be affected by persistent high temperatures, possibly resulting in more food-borne diseases9. Some studies have reported that food poisoning10,11 and electrolyte imbalance12 are more likely to occur during periods of persistent hot temperatures. However, studies on the effect of heat waves on childhood diarrhea are scarce.
Existing studies looking at the impact of temperature on diarrheal diseases mainly used time-series approach and tended to obtain temperature data from one ground-monitoring site or average from a network of sites3,13, and the several monitoring sites are normally in or nearby the urban areas14. This may render measurement bias because temperature usually varies spatially across one city15 due to urban heat island16. Satellite-based monitoring data can largely solve this problem, given its broad spatial coverage. Estes et al. have applied the remote sensing technology to examining the effect of temperature on blood pressure17. However, to date, no study has used satellite remote sensing data to examine the relationship between temperature and childhood diarrhea.
This study used the data on satellite remote sensing temperature and attempted to address three research issues: i) What is the relationship between temperature and emergency department visits (EDVs) for childhood diarrhea in Brisbane, Australia? ii) Is there any added effect attributable to heat waves? iii) Is there any change over time in the effect of temperature on childhood diarrhea during the study period?
Results
Summary statistics
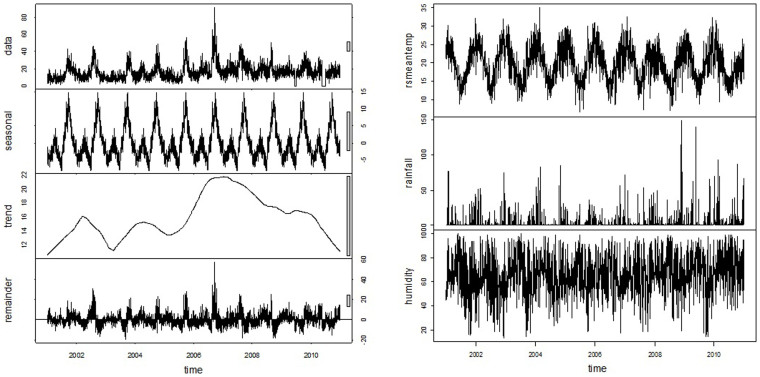
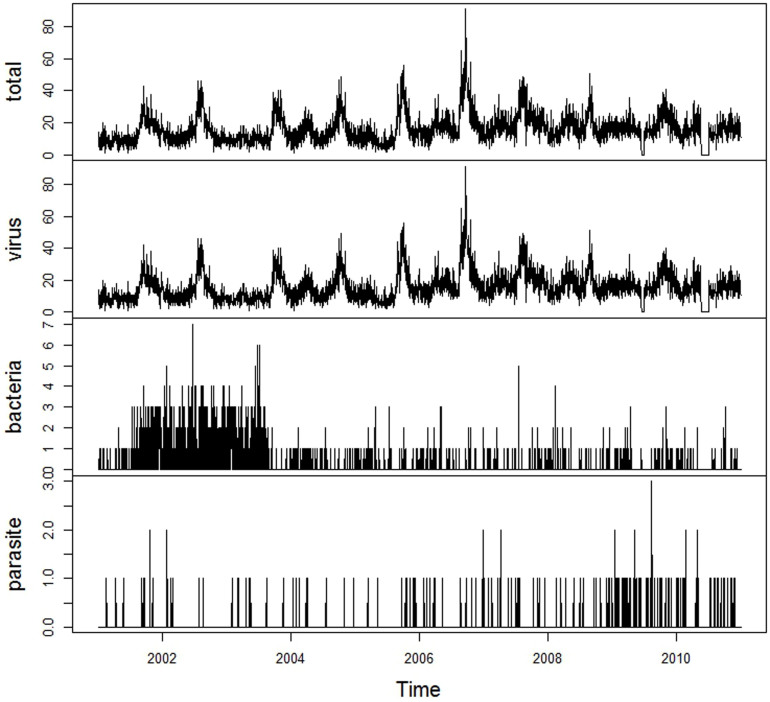
There were a total of 58166 EDVs for childhood diarrhea during the study period. Table 1 presents the summary statistics of daily weather variables and EDVs for childhood diarrhea in the total children population and each subgroup. The mean value of satellite remote sensing temperature was 19.8°C. The average values of relative humidity and rainfall were 65.0% and 2.2 mm, respectively. The mean value of daily EDVs for childhood diarrhea was 15.9 (range = 10–91), with the predominant pathogen being virus (mean = 15.6). There were very few EDVs for bacterial (mean = 0.3) and parasitic (mean = 0.04) diarrhea every day. Figure 1 shows the daily distributions of decomposed EDVs for childhood diarrhea and weather variables, illustrating a strong seasonal trend for diarrhea and satellite remote sensing temperature. The daily distributions of EDVs for viral, bacterial and parasitic diarrhea were presented in Figure 2.
Table 1. Summary statistics for climatic variables and pediatric diarrhea in Brisbane, Australia, 2001–2010.
| Percentile | |||||||
|---|---|---|---|---|---|---|---|
| Variables | Mean | SD | Min | 25 | 50 | 75 | Max |
| RS mean temperature (°C)* | 19.8 | 4.6 | 6.5 | 16.2 | 19.9 | 23.3 | 32.6 |
| Relative humidity (%) | 65.0 | 15.0 | 13.0 | 56.0 | 65.0 | 75.0 | 100.0 |
| Rainfall (mm) | 2.2 | 8.3 | 0 | 0 | 0 | 0.4 | 149.0 |
| Diarrhea | 15.9 | 8.8 | 0 | 10 | 14 | 20 | 91 |
| Viral diarrhea | 15.6 | 8.8 | 0 | 10 | 14 | 20 | 91 |
| Bacterial diarrhea | 0.3 | 0.7 | 0 | 0 | 0 | 0 | 7 |
| Parasitic diarrhea | 0.04 | 0.2 | 0 | 0 | 0 | 0 | 3 |
| (0–1) | 4.0 | 2.7 | 0 | 2 | 4 | 6 | 18 |
| [1–2) | 4.0 | 3.3 | 0 | 2 | 3 | 5 | 25 |
| [2,5) | 5.0 | 3.5 | 0 | 2 | 4 | 6 | 37 |
| [5,14] | 2.9 | 1.9 | 0 | 1 | 2 | 4 | 15 |
| Male | 7.3 | 4.6 | 0 | 4 | 7 | 9 | 47 |
| Female | 8.6 | 5.2 | 0 | 5 | 8 | 11 | 44 |
| Indigenous | 0.7 | 1.0 | 0 | 0 | 1 | 2 | 15 |
| Non-indigenous | 15.2 | 8.8 | 0 | 9 | 14 | 20 | 91 |
*RS: remote sensing.
Figure 1. The distribution of EDVs for childhood diarrhea and climate in Brisbane, from 2001 to 2010.
Figure 2. The temporal distribution of diarrhea caused by different pathogens.
The Spearman correlations between climate variables and EDVs for childhood diarrhea are presented in Table 2. EDVs for childhood diarrhea were positively correlated with satellite remote sensing temperature (r = 0.04, P < 0.01), and negatively correlated with relative humidity (r = −0.11, P < 0.01).
Table 2. Spearman's correlation between daily weather conditions, air pollutants and pediatric diarrhea in Brisbane, Australia, from 2001–2010.
| RS mean temperature | Relative humidity | Rainfall | Diarrhea | Viral diarrhea | Bacterial diarrhea | Parasitic diarrhea | |
|---|---|---|---|---|---|---|---|
| RS mean temperature | 1.00 | ||||||
| Relative humidity | −0.25* | 1.00 | |||||
| Rainfall | −0.03 | 0.38* | 1.00 | ||||
| Diarrhea | 0.04* | −0.11* | 0.01 | 1.00 | |||
| Viral diarrhea | 0.02 | −0.13* | −0.01 | 0.99* | 1.00 | ||
| Bacterial diarrhea | 0.02 | −0.04* | −0.01 | −0.03 | −0.11* | 1.00 | |
| Parasitic diarrhea | 0.01 | −0.01 | −0.02 | 0.05* | 0.03 | −0.03 | 1.00 |
*P < 0.01.
The effect of temperature on EDVs for childhood diarrhea
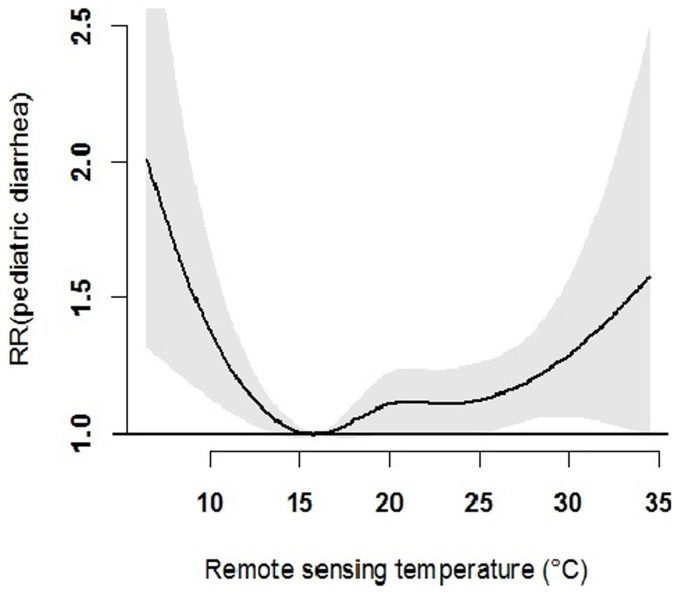
Figure 3 reveals that both low and high temperatures were associated with increase in EDVs for childhood diarrhea. Table 3 quantitatively depicts the effects of temperature on EDVs for childhood diarrhea by pathogen, age, gender and Indigenous status. No significant relationship between temperature and bacterial diarrhea was found. The relative risk (RR) of diarrhea during hot days in children aged 1–2 years (not including 2 years) was (RR: 1.17; 95% Confidence interval (CI): 1.10–1.25) greater than children of other age groups, and the RR of diarrhea during cold days in children aged 2–5 years (RR: 1.10; 95% CI: 1.03–1.18) was greater than other age groups. The effects of extreme temperatures on male children and Indigenous children appeared to be higher than female and non-Indigenous children, respectively. Heat effect on EDVs for childhood diarrhea was acute, mainly occurring on the current day of exposure, and cold effect happened after several days of exposure.
Figure 3. The overall effect of mean temperature on childhood diarrhea in Brisbane, from 2001 to 2010.
Table 3. The cumulative effect of high and low temperatures on EDVs for pediatric diarrhea in Brisbane, with 99th percentile (29.6°C) and 1st (10.4°C) of temperature relative to reference temperature (16°C).
| Heat effect (Relative risk (95% CI)) | Cold effect (Relative risk (95% CI)) | |||||
|---|---|---|---|---|---|---|
| Diseases | Lag 0–1 | Lag 0–7 | Lag 0–10 | Lag 0–1 | Lag 0–7 | Lag 0–10 |
| Total | 1.08(1.04,1.13)* | 0.99(0.96,1.02) | 1.01(0.96,1.06) | 1.04(0.99,1.09) | 1.02(0.98.1.05) | 1.05(1.01,1.10)* |
| Viral diarrhea | 1.10(1.06,1.13)* | 1.01(0.97,1.05) | 0.99(0.93,1.05) | 1.02(0.99,1.06) | 1.01(0.98,1.05) | 1.06(1.01,1.12)* |
| Bacterial diarrhea | 1.01(0.83,1.23) | 0.85(0.68,1.07) | 1.34(0.95,1.91) | 1.12(0.92,1.37) | 1.05(0.84,1.28) | 0.87(0.61,1.24) |
| (0–1) | 1.06(1.01,1.13)* | 0.99(0.95,1.03) | 0.98(00.90,1.06) | 1.06(0.99,1.13) | 1.01(0.97,1.05) | 0.99(0.92,1.07) |
| [1–2) | 1.17(1.10,1.25)* | 0.98(0.94,1.03) | 1.07(0.98,1.17) | 1.03(0.97,1.09) | 1.01(0.97.1.05) | 1.06(0.98,1.04) |
| [2,5) | 1.07(1.01,1.13)* | 1.00(0.96,1.04) | 1.01(0.93,1.10) | 1.03(0.97,1.09) | 1.02(0.98,1.06) | 1.10(1.03,1.18)* |
| [5,14] | 1.03(0.96,1.11) | 0.99(0.94,1.04) | 0.97(0.88,1.06) | 1.07(0.98,1.17) | 1.02(0.97,1.07) | 1.09(1.01,1.18)* |
| Male | 1.10(1.05,1.15)* | 0.98(0.95,1.02) | 1.01(0.95,1.08) | 1.04(0.99,1.09) | 1.02(0.98,1.05) | 1.06(1.01,1.12)* |
| Female | 1.07(1.02,1.12)* | 0.99(0.96,1.03) | 1.00(0.94,1.07) | 1.03(0.99,1.08) | 1.02(0.99,1.05) | 1.05(0.99,1.11) |
| Indigenous | 1.10(1.01,1.28)* | 1.05(0.95,1.16) | 1.12(0.92,1.36) | 1.15(0.98,1.33) | 1.01(0.92,1.11) | 1.18(1.01,1.39)* |
| Non-indigenous | 1.08(1.04,1.12)* | 0.99(0.96,1.01) | 1.00(0.95,1.06) | 1.03(0.98,1.09) | 1.02(0.99,1.04) | 1.03(1.01,1.05)* |
*P-value < 0.05.
The added effect of heat waves
Table 4 shows the daily excess EDVs for childhood diarrhea on heat wave days compared with non-heat wave days. We found no apparent added effect of heat waves on EDVs for childhood diarrhea while using the heat wave definitions of two or more consecutive days with the temperature over the 95th percentile. However, we found significant added effects of heat waves on EDVs for childhood diarrhea at the temperature threshold over the 99th percentile. Further, with heat wave days increasing from two to three consecutive days, the number of EDVs for childhood diarrhea due to added effect of heat waves rose from three to seven.
Table 4. Pediatric diarrhea due to the added effect of heat waves in Brisbane, Australia, from 2001 to 2010.
| Heat Waves | ||||
|---|---|---|---|---|
| No. of Consecutive Days | Percentile | Days | Diarrhea | 95% CI |
| ≥2 | ≥95th | 58 | 0 | (−1,1) |
| ≥99th | 6 | 3* | (1,5) | |
| ≥3 | ≥95th | 31 | 0 | (−1,1) |
| ≥99th | 2 | 7* | (2,13) | |
| ≥4 | ≥95th | 15 | 0 | (−1,2) |
| ≥99th | - | - | - | |
*P < 0.05.
Change over time in the effect of temperature on childhood diarrhea
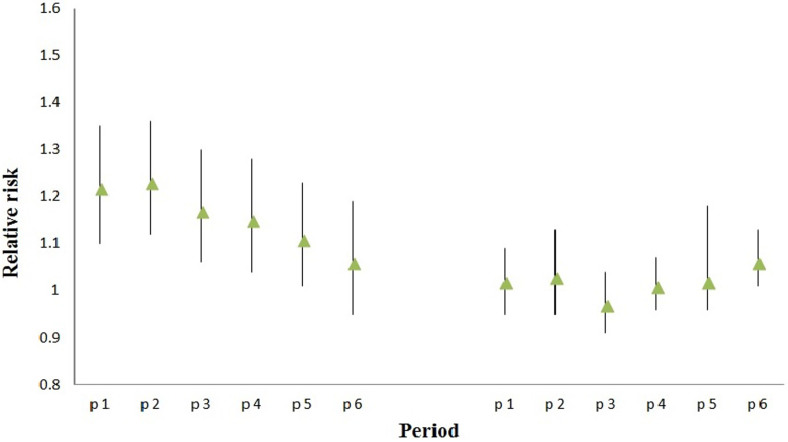
Figure 4 illustrates the change in the temperature effect of EDVs for childhood diarrhea over time. The heat effects increased slightly from Period 1 (2001–2005) to Period 2 (2002–2006) and showed a decreasing trend thenceforward. No significant change over time in the cold effect on EDVs for childhood diarrhea was found.
Figure 4. The change over time in the temperature effect on childhood diarrhea.
Table 5 shows the added effects of heat waves on EDVs for childhood diarrhea in the six periods (2001–2005, 2002–2006, 2003–2007, 2004–2008, 2005–2009 and 2006–2010). Statistically significant added effect of heat waves on EDVs for childhood diarrhea was observed only in the last period (2006–2010).
Table 5. Pediatric diarrhea due to the added effect of heat waves in Brisbane, Australia.
| No. of consecutive days | Percentile | Days | Diarrhea | 95% CI |
|---|---|---|---|---|
| 2001–2005 | ||||
| ≥2 | ≥95th | 26 | 1 | (0,1) |
| ≥99th | 4 | 1 | (−2,5) | |
| ≥3 | ≥95th | 11 | 1 | (−1,2) |
| ≥99th | 1 | 0 | (−7,7) | |
| ≥4 | ≥95th | 4 | 0 | (−1,2) |
| ≥99th | - | - | - | |
| 2002–2006 | ||||
| ≥2 | ≥95th | 22 | 0 | (−1,1) |
| ≥99th | 2 | 1 | (−2,4) | |
| ≥3 | ≥95th | 9 | 0 | (−1,2) |
| ≥99th | - | - | - | |
| ≥4 | ≥95th | 4 | 0 | (−3,2) |
| ≥99th | - | - | - | |
| 2003–2007 | ||||
| ≥2 | ≥95th | 22 | 0 | (−1,1) |
| ≥99th | 2 | 0 | (−3,3) | |
| ≥3 | ≥95th | 9 | 0 | (−1,1) |
| ≥99th | - | - | - | |
| ≥4 | ≥95th | 4 | −1 | (−2,1) |
| ≥99th | - | - | - | |
| 2004–2008 | ||||
| ≥2 | ≥95th | 24 | 0 | (−1,1) |
| ≥99th | 3 | 0 | (−4,4) | |
| ≥3 | ≥95th | 10 | −1 | (−2,1) |
| ≥99th | 1 | 2 | (−9,13) | |
| ≥4 | ≥95th | 4 | −1 | (−3,1) |
| ≥99th | - | - | - | |
| 2005–2009 | ||||
| ≥2 | ≥95th | 29 | 0 | (−1,1) |
| ≥99th | - | - | - | |
| ≥3 | ≥95th | 14 | 5 | (−8,18) |
| ≥99th | - | - | - | |
| ≥4 | ≥95th | 9 | −2 | (−4,1) |
| ≥99th | - | - | - | |
| 2006–2010 | ||||
| ≥2 | ≥95th | 33 | 0 | (−1,1) |
| ≥99th | 2 | 7* | (1,14)* | |
| ≥3 | ≥95th | 19 | 0 | (−1,1) |
| ≥99th | 1 | 13* | (1,25)* | |
| ≥4 | ≥95th | 12 | 0 | (−2,2) |
| ≥99th | - | - | - |
*P < 0.05.
Discussion
The spatial variability of temperature across a city has been well documented in the literature18. Existing studies quantifying the impact of temperature on childhood diarrhea tend to use data collected from ground monitors in a city3. Due to limited number of ground monitoring sites, the temperature collected may not be representative of the exposure of whole population, which possibly results in measurement bias in the effect estimates. In this study, we used satellite remote sensing data to minimise this problem. This study examined the effects of both high and low temperatures as well as heat waves on childhood diarrhea, while our previous work only examined the effects of temperature variation on childhood diarrhea14. Both heat and cold were associated with increase in EDVs for childhood diarrhea in Brisbane. An added effect of heat waves on childhood diarrea was found, though this effect varied greatly across the study period. The effect of high temperature on childhood diarrhea showed a decreasing trend over time.
Both heat and cold have been found to be associated with increases in EDVs for childhood diarrhea in Brisbane, which may be partially explained by three reasons. First, high temperature may impact the food chain, from food preparation stage to production process9, and expose children more to contaminated food. Second, low temperature increases the replication and survival of virus, e.g., rotavirus19. Third, extremely low and high temperatures may alter children's hygiene behaviours (e.g., water drinking behaviour).
As climate change continues, global surface average temperature will increase, and heat-related diarrhea burden may increase accordingly, but cold related diarrhea burden may decrease, especially for viral diarrhea which favours cold temperature20. Hence, it is essential to explore the balance between cold and heat effects on childhood diarrhea. In this study, we found cold effect on childhood diarrhea was greater than heat effect, which might be explained by the fact that in industrialized countries, interventions to improve hygiene and sanitation may decrease the occurrence of diarrhea caused by bacteria and parasites, but for rotavirus-related diarrhea which is spread from person-to person, these interventions may be less effective, and virus may be the dominant aetiological pathogen in these regions21,22,23. This finding implies that EDVs for childhood diarrhea in Brisbane related to the main effect of temperature may not increase greatly as climate change progresses.
In this study, we found Indigenous children were particularly vulnerable to the impact of temperature on diarrhea, echoing to a cohort study finding that Indigenous Australians were very sensitive to high and low temperatures24. Indigenous children require more public health attention in Australia. They have restricted access to medical service and climate change adaptation infrastructures, and high or cold temperature may trigger or exacerbate their existing health problems. The poor housing conditions may also render their greater vulnerability to heat or cold impact25. The RR of diarrhea in male children during extreme temperatures was greater than female children, which might be partially due to their body composition26 and behaviours27. Basu et al. argued that differences in the effect of temperature on males and females varied among different locations and populations28, and we believe that the differences of temperature sensitivity between boys and girls may even vary with disease types.
An added effect of heat waves on childhood diarrhea has been observed in this study, and this effect increased with the intensity and duration of heat waves, suggesting that the burden of childhood diarrhea associated with heat waves may increase as more frequent, intense and longer-lasting heat waves are projected to occur in the future8,29. Parents and caregivers should be educated and made aware of this risk and take precautionary measures to protect their children during heat waves, and the government may also consider the development of an heat early warning system as it will substantially decrease children's disease burden in heat waves30. Interestingly, we found that the effect of high temperature on childhood diarrhea had a declining trend across the study period, but the added effect of heat waves appeared to increase in recent years. The decreasing trend in the main effect of heat on childhood diarrhea may be partially explained by the decreasing mean temperatures in the last four years (Figure 1). The finding also imply that children in Brisbane might be experiencing better hygiene standards and/or have increasingly adapted to mild heat in recent years, but persistent extremely hot days still pose a huge challenge to the health of their intestinal system.
There are several strengths of this study. This is the first study to apply the satellite remote sensing technology to quantifying the temperature-diarrhea association, which minimized the measurement bias. Our study examined the balance between heat and cold effects on childhood diarrhea and firstly reported the added effect of heat waves on childhood diarrhea. Two main weaknesses should also be acknowledged. First, the ecological design restricts us to explore the possible confounders (people's drinking behaviour, etc.) and may cause ecological fallacy. Second, we did not have the pathogen data and thus could not specifically analyse the relation between temperature and diarrhea caused by different pathogens.
In conclusion, both hot and cold temperatures were associated with childhood diarrhea, and male children and Indigenous children appeared to be at higher risk. Heat waves had an added effect on childhood diarrhea, which increased with intensity and duration of heat waves. Parents, caregivers, schools and the government should take action to enhance the children's intestinal health particularly during extreme temperatures and promote protective measures in advance.
Methods
Data collection
Public hospital emergency departments are a significant and high-profile component of Australia's health care system31. EDVs data, which were classified according to International Classification of Diseases, 9th and 10th versions (ICD-9 and ICD-10), were supplied by Queensland Health. We selected the following codes for diarrhea in children aged 0–14 years: ICD-9 codes: 001–003, 004, 005, 006.0–006.2, 007.0–007.5, 008–009; ICD–10 codes: A00–A03, A04, A05, A06.0–A06.3, A06.9, A07.0–A07.2, A07.9, A08–A09. Existing evidence suggests that there is significant difference in the seasonal variations of infection caused by various pathogens32,33. Viral (008–009, and A08–A09), bacterial (001–003, 004, 005, and A00–A03, A04, A05) and parasitic infections (006.0–006.2, 007.0–007.5 and A06.0–A06.3, A06.9, A07.0–A07.2, A07.9) were separately analysed. Ethical approval was obtained from the Human Research Ethics Committee of Queensland University of Technology (Australia) prior to the data being collected. Patient information was de-identified and thus no written informed consent was obtained. Data on rainfall and relative humidity were obtained from the Australian Bureau of Meteorology. The data were collected from eight monitor stations throughout Brisbane, and then averaged.
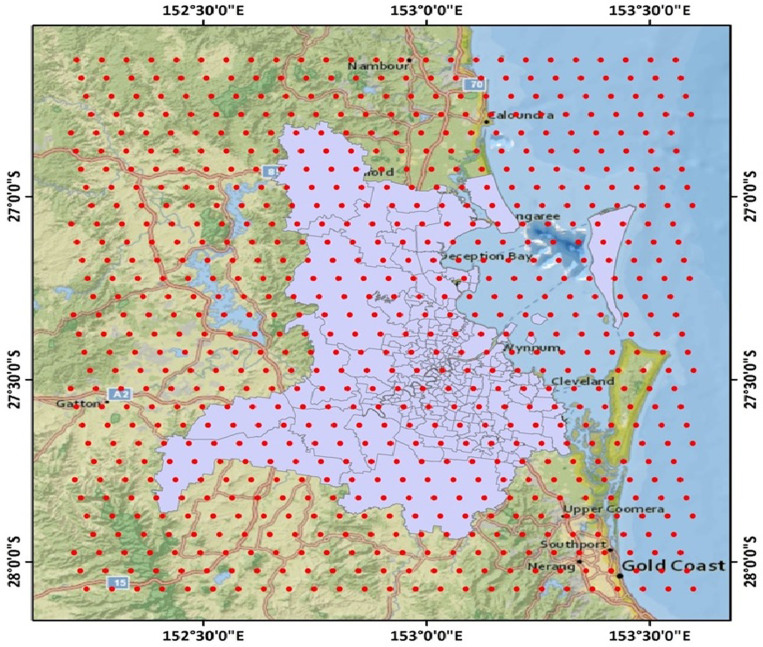
Land surface temperature (LST) is the mean radiative skin temperature of an area of land resulting from the energy balance between solar heating and land-atmosphere cooling. The Moderate Resolution Imaging Spectroradiometer (MODIS) instruments were aboard on the EOS Terra and Aqua satellites in 1999 and 2002, respectively34,35. Version 5 MODIS LST data have been extensively validated globally, showing that the accuracy of the MODIS LST product is better than 1 K in most cases36,37. For our study, Level 3 MODIS Land Surface Temperature data (MOD11B1 for Terra from 2001 to 2010 and MYD11B1 for Aqua from 2002 to 2010) at 6 km spatial resolution were downloaded from NASA's Level 1 and Atmospheric Archive and Distribution System (http://ladsweb.nascom.nasa.gov) (Figure 5). Each data file contains both a daytime (~10:30 am for Terra, ~1:30 pm for Aqua) and a nighttime (~10:30 pm for Terra, and ~1:30 am for Aqua) LST measurement. Daily temperature values retrieved from the two satellites were averaged to get the daily mean temperature (satellite remote sensing temperature). In this study, we obtained daily temperature from more than 300 grids in Brisbane, which substantially minimise the measurement bias due to limited number of monitoring sites.
Figure 5. The areas where satellite remote sensing temperature data were collected (generated by ArcMap 9.3, ESRI).
Data analysis
The definition of heat wave
There is no consistent definition for heat wave38. We took both intensity and duration of extreme temperatures into account to define heat wave: 1) Intensity: the 95th and 99th percentiles of the daily mean temperature as the hot threshold; and 2) Duration: a minimum of two to four consecutive days with temperatures above the hot threshold.
Stage I quantifying the main effect of temperature
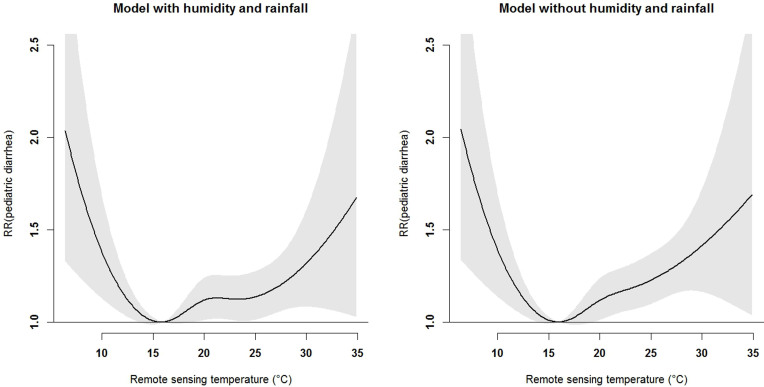
To quantify the main effect of temperature on EDVs for childhood diarrhea, we used a quasi-Poisson generalized linear model combined with a distributed lag non-linear model (DLNM)14. A “natural cubic spline–natural cubic spline” DLNM was performed to examine the temperature effect using four degrees of freedom (df) for both temperature and lag dimensions. Originally we used a lag of 21 days to test the lagged effects of temperature on both viral and bacterial infections (parasitic infections were not analysed due to its very limited number of cases), but we did not find any significant effect of temperature on bacterial infections. Thus, we chose the number of lag days based on temperature effect on viral infections and also on the previous works we've done14. Rainfall and relative humidity was controlled for using a natural cubic spline with four df. To test the possible impact of rainfall and relative humidity on temperature-diarrhea relationship, we plotted the models including and excluding rainfall and relative humidity (Figure 6). Long-term trend and seasonality were controlled for using a natural cubic spline with six df per year of data. Day of week was controlled for as a categorical variable. Public holiday was also controlled for in the model.
Figure 6. The overall effects of temperature on diarrhea produced by models with and without relative humidity and rainfall.
After all the other parameters were confirmed, we checked the temperature–diarrhea plot and chose the reference temperature by visual inspection. We calculated the relative risk of EDVs for childhood diarrhea associated with high temperature (29.6°C, 99th percentile of mean temperature) and low temperature (10.4°C, 1st percentile of mean temperature) relative to the reference temperature (chosen to be 16.0°C). To assess whether the association between temperature and diarrhea changed over time in the study period, we specifically quantified the effect of temperature on EDVs for childhood diarrhea for a sliding window of five years (2001–2005, 2002–2006, 2003–2007, 2004–2008, 2005–2009 and 2006–2010).
Stage II examining the added effect of heat waves
To test whether there is an added effect of heat waves on diarrhea, we removed the main effect of temperature on EDVs for childhood diarrhea in Stage I model, and considered the residuals of Stage I model as the dependent variable of Stage II model39. We assumed a maximum lag of 10 days for examining the lagged effects of heat waves.
All data analysis was conducted using R environment (Version 2.15). The sensitivity analysis was conducted by adjusting df for temperature and time.
Author Contributions
Z.X. and S.T. designed the study, Z.X. analysed the data and drafted the manuscript, Y.L., Z.M., G.S.T., W.H. and S.T. revised the manuscript.
Acknowledgments
The authors thank the National Health and Medical Research Council Research Fellowship (#553043).
References
- McMichael A. J. Globalization, climate change, and human health. N Engl J Med 368, 1335–1343 (2013). [DOI] [PubMed] [Google Scholar]
- Sheffield P. & Landrigan P. Global climate change and children's health: threats and strategies for prevention. Environ Health Perspect 119, 291–298 (2011). [DOI] [PMC free article] [PubMed] [Google Scholar]
- Checkley W. et al. Effect of El Niño and ambient temperature on hospital admissions for diarrhoeal diseases in Peruvian children. Lancet 355, 442–450 (2000). [DOI] [PubMed] [Google Scholar]
- Gasparrini A. & Armstrong B. The impact of heat waves on mortality. Epidemiology 22, 68–73 (2011). [DOI] [PMC free article] [PubMed] [Google Scholar]
- Ma W. et al. The impact of the 2008 cold spell on mortality in Shanghai, China. Int J Biometeorol 57, 179–184 (2013). [DOI] [PubMed] [Google Scholar]
- Anderson B. & Bell M. Weather-related mortality: how heat, cold, and heat waves affect mortality in the United States. Epidemiology 20, 205–213 (2009). [DOI] [PMC free article] [PubMed] [Google Scholar]
- Hajat S. et al. Impact of High Temperatures on Mortality: Is There an Added Heat Wave Effect? Epidemiology 17, 632–638 (2006). [DOI] [PubMed] [Google Scholar]
- Meehl G. A. & Tebaldi C. More Intense, More Frequent, and Longer Lasting Heat Waves in the 21st Century. Science 305, 994–997 (2004). [DOI] [PubMed] [Google Scholar]
- D'Souza R., Becker N., Hall G. & Moodie K. Does ambient temperature affect foodborne disease? Epidemiology 15, 86–92 (2004). [DOI] [PubMed] [Google Scholar]
- Bentham G. & Langford I. Climate change and the incidence of food poisoning in England and Wales. Int J Biometeorol 39, 81–86 (1995). [DOI] [PubMed] [Google Scholar]
- Bentham G. & Langford I. Environmental temperatures and the incidence of food poisoning in England and Wales. Int J Biometeorol 45, 22–26 (2001). [DOI] [PubMed] [Google Scholar]
- Knowlton K. et al. The 2006 California heat wave: impacts on hospitalizations and emergency department visits. Environ Health Perspect 117, 61–67 (2009). [DOI] [PMC free article] [PubMed] [Google Scholar]
- Hashizume M. et al. Association between climate variability and hospital visits for non-cholera diarrhoea in Bangladesh: effects and vulnerable groups. Int J Epidemiol 36, 1030–1037 (2007). [DOI] [PubMed] [Google Scholar]
- Xu Z. et al. Is diurnal temperature range a risk factor for childhood diarrhea? PLoS ONE 8, e64713 (2013). [DOI] [PMC free article] [PubMed] [Google Scholar]
- Zhang K. et al. Geostatistical exploration of spatial variation of summertime temperatures in the Detroit metropolitan region. Environ Res 111, 1046–1053 (2011). [DOI] [PMC free article] [PubMed] [Google Scholar]
- Laaidi K. et al. The impact of heat islands on mortality in Paris during the August 2003 heat wave. Environ Health Perspect 120, 254–259 (2012). [DOI] [PMC free article] [PubMed] [Google Scholar]
- Estes M. et al. Use of remotely sensed data to evaluate the relationship between living environment and blood pressure. Environ Health Perspect 117, 1832–1838 (2009). [DOI] [PMC free article] [PubMed] [Google Scholar]
- Kestens Y. et al. Modelling the variation of land surface temperature as determinant of risk of heat-related health events. Int J Health Geogr 10, 7 (2011). [DOI] [PMC free article] [PubMed] [Google Scholar]
- D'Souza R. M., Hall G. & Becker N. G. Climatic factors associated with hospitalizations for rotavirus diarrhoea in children under 5 years of age. Epidemiol Infect 136, 56–64 (2008). [DOI] [PMC free article] [PubMed] [Google Scholar]
- Xu Z. et al. Climate change and children's health—A call for research on what works to protect children. Int J Environ Res Public Health 9, 3298–3316 (2012). [DOI] [PMC free article] [PubMed] [Google Scholar]
- Malek M. A. et al. Diarrhea- and rotavirus-associated hospitalizations among children less than 5 years of age: United States, 1997 and 2000. Pediatrics 117, 1887–1892 (2006). [DOI] [PubMed] [Google Scholar]
- Olesen B. et al. Etiology of diarrhea in young children in Denmark: a case-control study. J Clin Microbiol 43, 3636–3641 (2005). [DOI] [PMC free article] [PubMed] [Google Scholar]
- Parashar U. D. et al. Global mortality associated with rotavirus disease among children in 2004. J Infect Dis 200, S9–S15 (2009). [DOI] [PubMed] [Google Scholar]
- Guo Y., Wang Z., Li S., Tong S. & Barnett A. Temperature sensitivity in indigenous Australians. Epidemiology 24, 471–472 (2013). [DOI] [PubMed] [Google Scholar]
- Bailie R., Stevens M., McDonald E., Brewster D. & Guthridge S. Exploring cross-sectional associations between common childhood illness, housing and social conditions in remote Australian Aboriginal communities. BMC Public Health 10, 147 (2010). [DOI] [PMC free article] [PubMed] [Google Scholar]
- Maeda T., Sugawara A., Fukushima T., Higuchi S. & Ishibashi K. Effects of lifestyle, body composition, and physical fitness on cold tolerance in humans. J Physiol Anthropol Appl Human Sci 24, 439–443 (2005). [DOI] [PubMed] [Google Scholar]
- White-Newsome J. L. et al. Assessing heat-adaptive behaviors among older, urban-dwelling adults. Maturitas 70, 85–91 (2011). [DOI] [PMC free article] [PubMed] [Google Scholar]
- Basu R. & Samet J. M. Relation between elevated ambient temperature and mortality: A review of the epidemiologic evidence. Epidemiol Rev 24, 190–202 (2002). [DOI] [PubMed] [Google Scholar]
- IPCC. Climate change 2013: the physical science basis. Contribution of Working Group I to the Fifth Assessment Report of the Intergovernmental Panel on Climate Change. (Cambridge University Press, Cambridge, 2013). [Google Scholar]
- Xu Z. et al. The impact of heat waves on children's health: a systematic review. Int J Biometeorol [Epub ahead of print]; 10.1007/s00484-013-0655-x (2013). [DOI] [PubMed] [Google Scholar]
- FitzGerald G. et al. Demand for public hospital emergency department services in Australia: 2000–2001 to 2009–2010. Emerg Med Australas 24, 72–78 (2012). [DOI] [PubMed] [Google Scholar]
- Chui K. K. H., Jagai J. S., Griffiths J. K. & Naumova E. N. Hospitalization of the Elderly in the United States for Nonspecific Gastrointestinal Diseases: A Search for Etiological Clues. Am J Public Health 101, 2082–2086 (2011). [DOI] [PMC free article] [PubMed] [Google Scholar]
- Naumova E. N. et al. Seasonality in six enterically transmitted diseases and ambient temperature. Epidemiol Infect 135, 281–292 (2007). [DOI] [PMC free article] [PubMed] [Google Scholar]
- Anderson T. L. et al. An “A-Train” strategy for quantifying direct climate forcing by anthropogenic aerosols. Bull Amer Meteor Soc 86, 1795–1809 (2005). [Google Scholar]
- Kaufman Y. J., Herring D. D., Ranson K. J. & Collatz G. J. Earth Observing System AM1 mission to Earth. Geoscience and Remote Sensing, IEEE Transactions on 36, 1045–1055 (1998). [Google Scholar]
- Wan Z. New refinements and validation of the MODIS Land-Surface Temperature/Emissivity products. Remote Sens Environ 112, 59–74 (2008). [Google Scholar]
- Wan Z., Zhang Y., Zhang Q. & Li Z.-l. Validation of the land-surface temperature products retrieved from Terra Moderate Resolution Imaging Spectroradiometer data. Remote Sens Environ 83, 163–180 (2002). [Google Scholar]
- Tong S., Wang X. Y. & Barnett A. G. Assessment of Heat-Related Health Impacts in Brisbane, Australia: Comparison of Different Heatwave Definitions. PLoS ONE 5, e12155 (2010). [DOI] [PMC free article] [PubMed] [Google Scholar]
- Xu Z. et al. Extreme temperatures and emergency department admissions for childhood asthma in Brisbane, Australia. Occup Environ Med 70, 730–5 (2013). [DOI] [PubMed] [Google Scholar]


