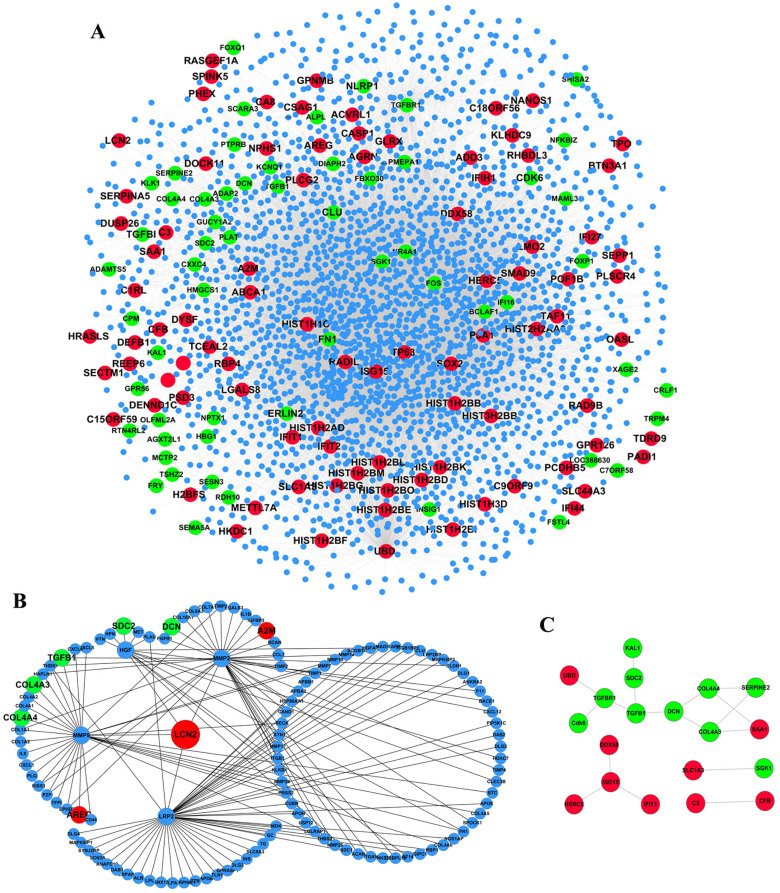
Figure 1. PPI sub-network generation by mapping DEGs to the HPRD&BioGRID parental PPI network.
(A) PPI sub-networks of total DEGs. (B) LCN2-central PPI sub-network. (C) Internal interactions of DEGs. Different colors of nodes indicate the types of proteins represented. Green and red nodes represent proteins encoded by down- and up-regulated genes, respectively. Blue nodes represent interacting proteins which were not significantly differentially expressed. The arrangement of nodes was applied to the “Spring Embedded” layout in Cytoscape.

