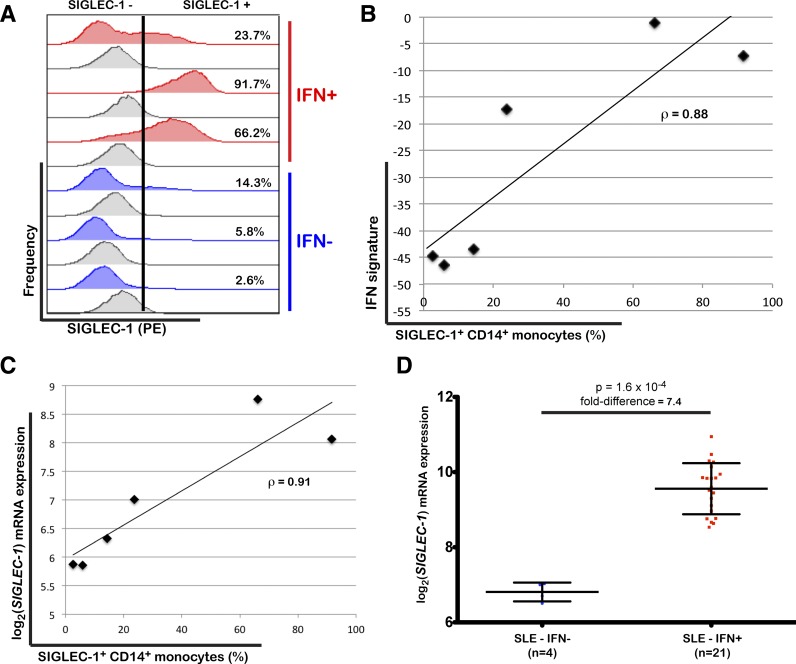
Figure 5.
SIGLEC-1 expression by CD14+ monocytes is a marker of increased IFN responses. A: Frequency of SIGLEC-1+ CD14+ monocytes was measured by flow cytometry in cryopreserved PBMCs from three patients with T1D with increased expression of IFN-inducible genes (IFN+) and three age- and sex-matched patients with T1D with low expression of IFN-inducible genes (IFN-). Histograms for the isotype control immunostainings are depicted in gray immediately below the respective volunteer. Positivity for SIGLEC-1 is defined on the basis of the upper one percentile of the respective isotype control (illustrated by the vertical black bar in one representative example). The percentage of SIGLEC-1+ CD14+ monocytes is indicated for each volunteer. B: Correlation between the frequency of SIGLEC-1+ CD14+ monocytes and the expression of the IFN signature in peripheral blood of the same six patients with T1D as measured by the projection of the expression of the IFN-inducible genes from each sample onto the first PC defined in the SLE group. C: Correlation between the frequency of SIGLEC-1+ CD14+ monocytes measured by flow cytometry and the normalized SIGLEC-1 mRNA expression in PBMCs from the six assessed patients with T1D as measured by DNA microarray. D: Scatter plot (mean ± SD) depicting the normalized SIGLEC-1 mRNA expression in PBMCs isolated from 25 patients with SLE stratified by the presence of an IFN signature (IFN+; red squares) or the absence of an IFN signature (IFN-; blue circles). The P value was calculated using a two-sided Wilcoxon test. ρ, correlation coefficient.

