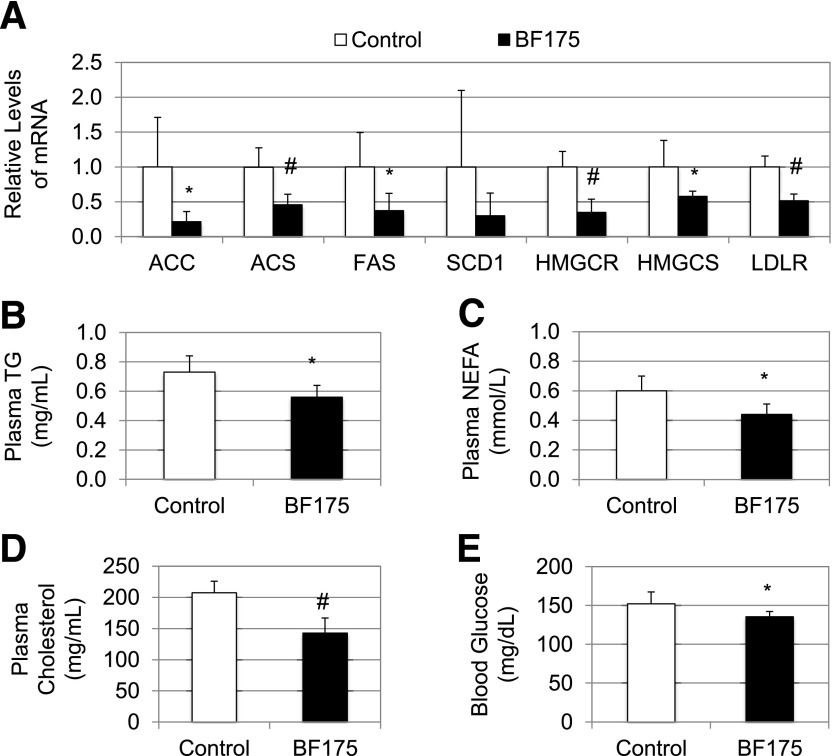
Figure 7.
C57BL/6J mice were first fed with HFD for 4 weeks and then continuously treated with HFD in the absence (control) or presence of BF175 (0.2% in HFD) for a total of 8 weeks. At the end of the treatment, mice were killed and plasma samples were collected. A: Relative mRNA levels of the indicated genes as detected by qRT-PCR in mouse livers. Plasma levels of triglycerides (TG) (B), free fatty acids (NEFA) (C), total cholesterol (D), and fasting blood glucose (E). All data represent the mean ± SD (n = 6). *P < 0.05; #P < 0.01 vs. control (HFD only).

