Figure 1.
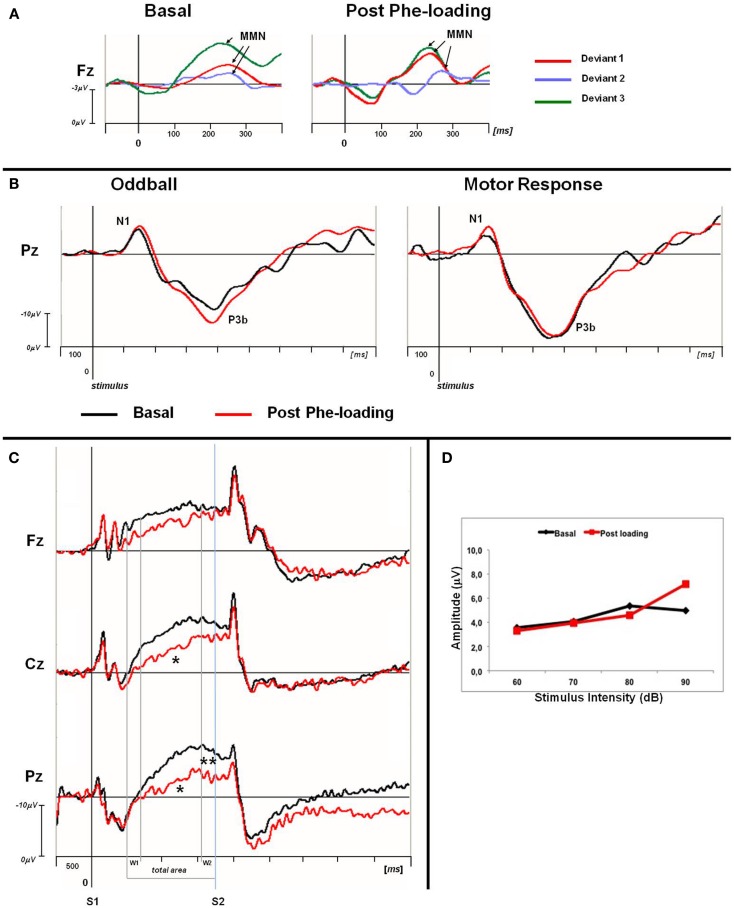
(A) Grand averaged MMN traces at Fz for basal and post Phe-loading condition. Difference waves are showed for each deviant stimulus (deviant 1: red line; deviant 2: blue violet line; deviant 3: green line). The analysis epoch for the MMN is 500 ms with a 100 ms pre-stimulus baseline. The arrows indicate the MMN peak for each difference waves. (B) Grand averaged P3 traces for oddball and motor response task at Pz site. For each task the basal (black) and post-loading trace (red) are superimposed. The epoch analysis of the P3 components is 1 s with a 100 ms pre-stimulus baseline. (C) Grand averaged CNV waveforms, with W1, W2, and total areas highlighted, superimposed at midline scalp sites for basal (black lines) and post-loading (red lines) evaluation. The epoch analysis is 5 s, with a 500 ms pre-stimulus baseline before S1. S1: warning stimulus (flash). S2: imperative stimulus (tone). The asterisks indicate statistical significant differences in CNV parameters (total area *p < 0.05; W2-CNV **p < 0.05). (D) ASF slopes of PKU subjects in basal (black) and post Phe-loading (red) condition.

