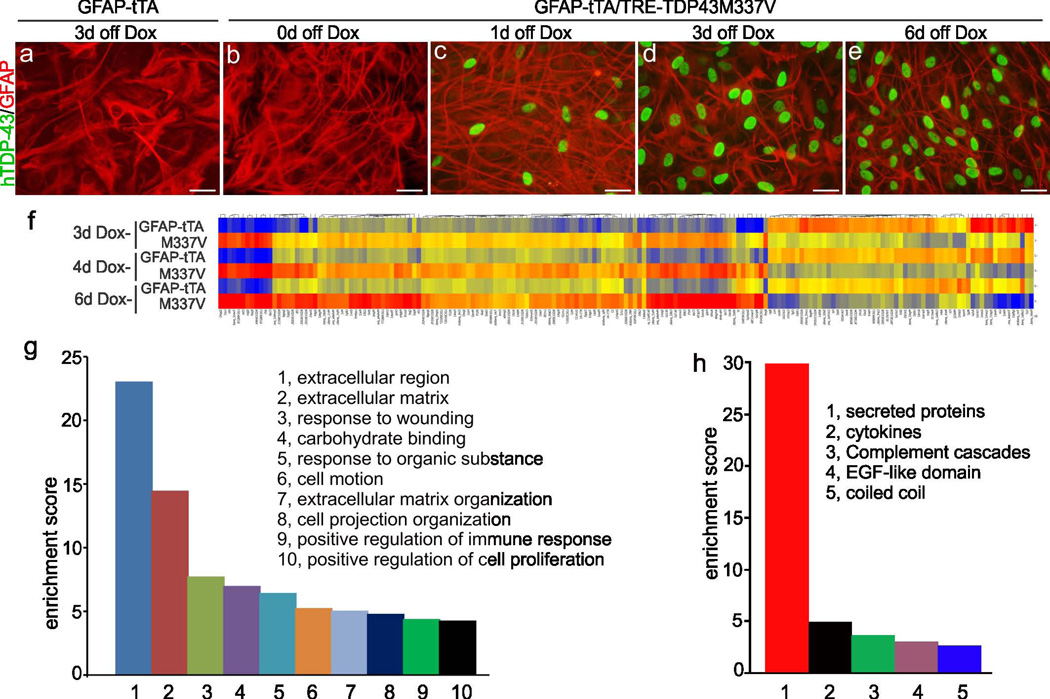
Figure 2.
Over-expression of mutant TDP-43 in astrocytes altered gene expression profile. (a-e) Immunostaining revealed that the TDP43M337V transgene (hTDP43) was rapidly induced in astrocytes purified from GFAP-tTA#2/TRE-TDP43M337V double-transgenic rats (M337V: b-e) but not in control cells purified from GFAP-tTA#2 single-transgenic rats (a). (f) Hierarchical cluster analysis revealed differential gene expression between tTA and M337V transgenic astrocytes at varying times after induction (Dox withdrawal: Dox-). Columns on the heat map correspond to individual probe sets, with red indicating higher expression, yellow indicating intermediate expression, and blue indicating lower expression. Heat map shows selected 449 genes with an absolute value of fold change > 2 at any of the three induction times (3, 4, or 6 days after Dox withdrawal). (g) Biological pathway analysis revealed many enriched pathways altered by TDP43M337V expression. Higher enrichment score indicates greater enrichment. (h) Further analysis revealed that most genes involved in the most highly enriched pathway (extracellular region of panel g) encode secretory proteins. Scale bars: 30 μm (a-e).

