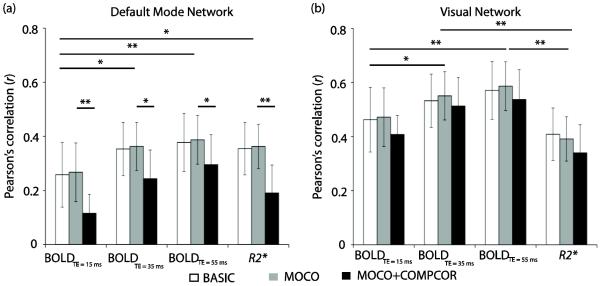
Figure 1.
Spatial correlation (r) values for the independent component analysis (ICA)-derived component that correlated highest with the default mode network (DMN; a) and visual network (VN; b) templates obtained from the literature. Note that these networks were obtained from ICA analysis of single-TE BOLD data, and therefore it is not surprising that the R2* maps had a slightly lower correlation with the template maps than the BOLD data (*P<0.05, **P<0.01). By performing network selection in this manner, subjective selection of networks is reduced. Error bars represent standard deviation.

