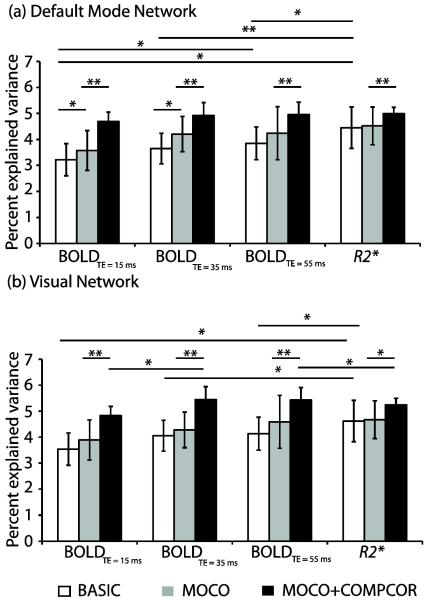
Figure 3.
Percent explained variance in the individual independent component analysis (ICA) for different experimental inputs and processing possibilities for (a) default mode network (DMN) and (b) visual network (VN). For minimally processed data, R2* maps provide the most explained variance, however in (MOCO+COMPCOR) data, there is less discrepancy in explained variance between data inputs, especially at intermediate and long TE. Error bars represent standard deviation. * P<0.05, **P<0.01

