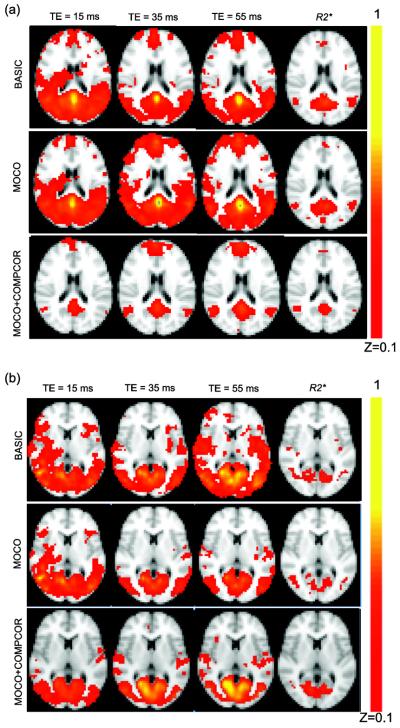
Figure 5.
(a) Average Fisher Z coefficient maps obtained from the Pearson's correlation, r in the default mode network (DMN) time course. Note that the R2* DMN maps were least altered for different processing strategy. BASIC BOLD data showed highest correlation to non-DMN gray matter regions, consistent with the most respiratory and cardiac noise contributions here. These non-specific spatial regions are reduced following nuisance reduction in MOCO+COMPCOR. (b) Fisher Z maps for VN demonstrate similar trends.

