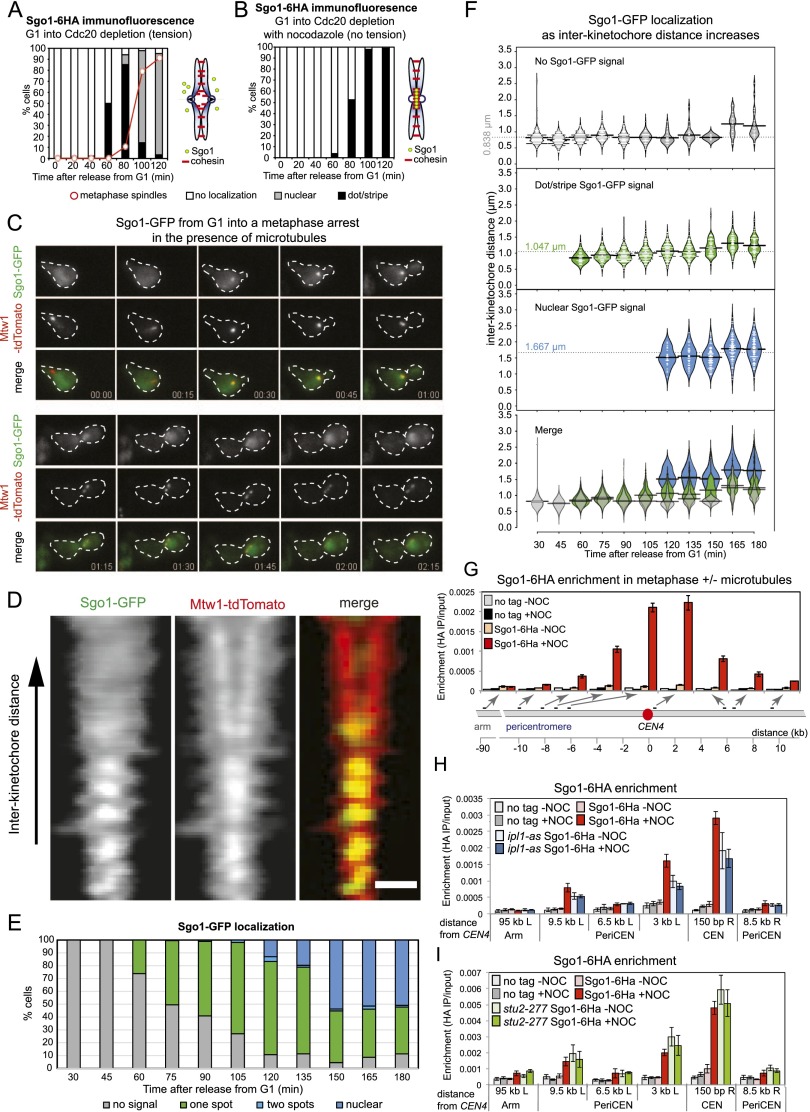
Figure 1.
Sgo1 is removed from the pericentromere in metaphase in the presence of microtubules. (A,B) Sgo1 dispersal into the nucleus in metaphase is dependent on microtubules. Cells carrying SGO1-6HA and pMET3-CDC20 (strain AM6390) were arrested in G1 with α factor. The culture was split, α factor was washed out, and both cultures were released into medium containing methionine to repress CDC20 and induce arrest in metaphase. Either DMSO (A; tension) or nocodazole (B; no tension) was added. Samples were extracted at the indicated intervals after release from G1 for Sgo1-6HA and tubulin immunofluorescence, and Sgo1 localization (no, dot/stripe, nuclear) and spindle morphology were scored. Schematic diagrams indicate chromosome configuration in the presence (A) or absence (B) of tension. (C) Loss of Sgo1-yeGFP from the pericentromere coincides with the appearance of a bilobed kinetochore signal. Cells carrying SGO1-yeGFP and MTW1-tdTomato (strain AM9233) were imaged on a microfluidics device at 15-min intervals after release from G1 arrest. (D–F) Sgo1-yeGFP loses its pericentromeric localization as kinetochore signals split. Strain AM9233 (pMET3-CDC20 SGO1-yeGFP MTW1-tdTomato) was arrested in G1 using α factor and released in medium containing 8 mM methionine to deplete Cdc20. Images of multiple cells were taken every 15 min, with the first time point taken 0.5 h after the release from G1. (D) Line scans across kinetochore foci of single cells were assembled from 100 images to generate a V plot showing Sgo1-GFP localization as interkinetochore distance increases. Bar, 2μm. (E) Bar chart showing the fraction of cells with the indicated Sgo1 localization at each time point. (F) The distance between Mtw1-tdTomato signals and the localization of Sgo1-yeGFP was scored in 200 cells. The bean plot shows the distribution of interkinetochore distances for which each localization type was scored. The horizontal line represents the mean. (G) Sgo1 is removed from the pericentromere at metaphase in the presence of microtubules. Strains AM6390 (pMET3-CDC20 SGO1-6HA) and AM2508 (pMET3-CDC20; no tag control) were released from G1 into medium containing methionine and either DMSO (−NOC) or nocodazole (+NOC). After 2 h, cells were harvested, and Sgo1-6HA levels at the indicated sites on chromosome IV were analyzed by ChIP-qPCR. The average of three experimental repeats (qPCR performed in triplicate in each case) is shown for AM6390, with error bars representing standard error. For the no tag control (AM2508), representative values are shown from one of these experiments. See also Supplemental Figure S2, G and H, for Sgo1-6HA association with sites on chromosomes III and V. (H) Wild-type (AM6390) and ipl1-as5 (AM8217) cells carrying pMET3-CDC20 and SGO1-6HA as well as a no tag control (AM2508) were treated as in G except that NA-PP1 (50 mM) was added to inhibit Ipl1 when bud formation was observed after release from G1. Sgo1-6HA levels at the indicated sites on chromosome IV were measured by ChIP-qPCR in cells harvested 2 h (wild type) or 2.5 h (ipl1-as) after release from G1 to obtain a similar number of cells arrested in metaphase. (I) The stu2-277 mutation prevents Sgo1 removal in the presence of microtubules. Wild-type (AM6390) and stu2-277 (AM9093) cells carrying pMET3-CDC20 and SGO1-6HA as well as a no tag control (AM2508) were treated as in G except that cells were shifted to 37°C after release from G1. Cells were harvested for Sgo1-6HA ChIP-qPCR after 1.5 h (wild type) or 2.25 h (stu2-277) to obtain similar numbers of cells arrested in metaphase. In H and I, the average of three independent repeats is shown, with error bars representing standard error.

