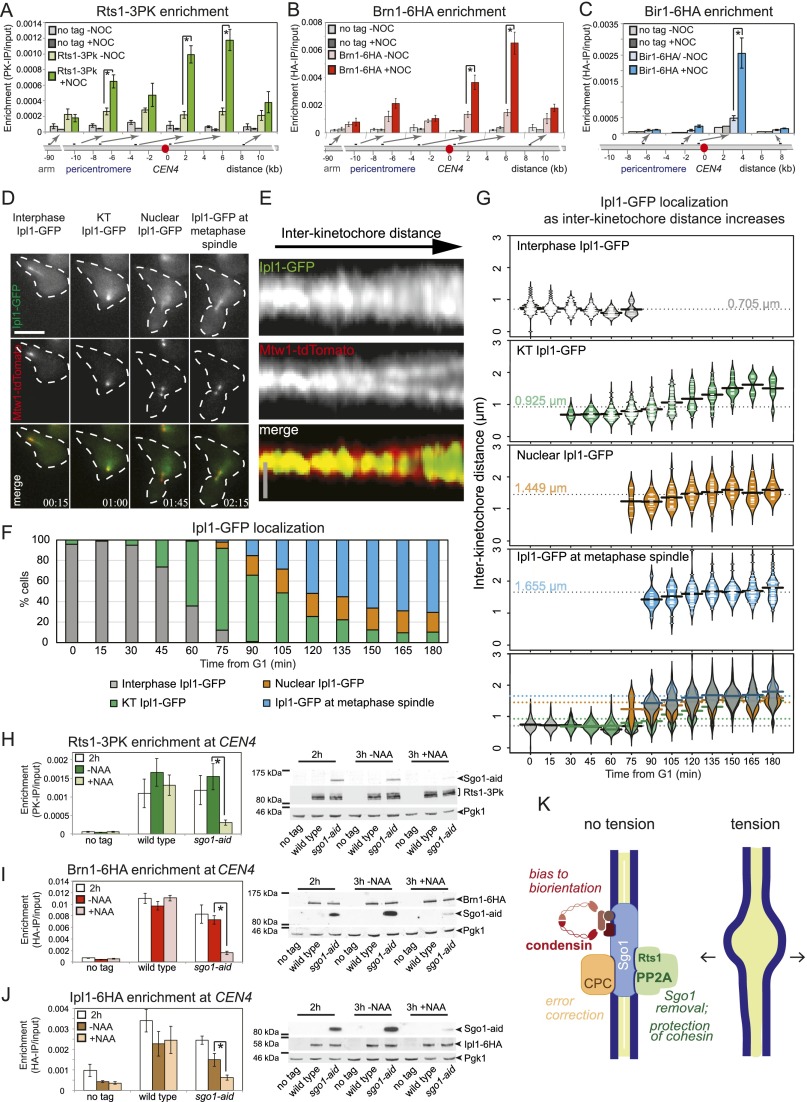
Figure 5.
Sgo1 removal from the pericentromere leads to disassembly of the signaling platform that responds to a lack of tension at kinetochores. (A–C) Sgo1 effectors are removed from the centromere in response to intersister kinetochore tension. The association of PP2ARts1 (A; Rts1), condensin (B; Brn1), and CPC (C; Bir1) subunits with the pericentromere is reduced in the presence of spindle tension. Strains carrying pMET3-CDC20 and producing the indicated tagged proteins were arrested in metaphase with or without microtubules as described in Figure 1G, and the levels of the indicated proteins were examined by ChIP-qPCR using anti-PK (A) or anti-HA (B,C) antibodies and primer sets at the locations shown. Strains used were AM2508 (no tag), AM9639 (RTS1-3PK), AM8955 (BRN1-6HA), and AM6941 (BIR1-6HA). Mean values are given, and error bars represent standard error, except where n = 2 (no tag in A), where they represent range. In A, the number of experimental repeats was four (AM9639; RTS1-3PK) or two (AM2508, no tag). In B, data are shown from three experimental repeats for both no tag (AM2508) and BRN1-6HA (AM8955). In C, data are from three experimental replicates (AM6941; BIR1-6HA) or one experiment (AM2508; no tag). The unpaired Student’s t-test was used to calculate significance. (*) P < 0.05. (D–G) Ipl1 relocalizes from kinetochores during metaphase. Cells carrying IPL1-yeGFP and MTW1-tdTomato (strain AM9231) were imaged on a microfluidics device at 15-min intervals after release from G1 arrest. (D) Examples of Ipl1-GFP localization observed are shown. Time is given relative to release from G1. Bar, 5 μm. See also Supplemental Movie S3. (E) Line scans across kinetochore foci of single cells were assembled from 100 images to generate a V plot showing Ipl1-GFP localization as interkinetochore distance increases. Bar, 2 μm. (F) Bar chart with the fraction of cells with the indicated Ipl1 localization at each time point is shown. (G) The distance between Mtw1-tdTomato signals and the localization of Ipl1-yeGFP was scored in at least 77 cells for each time point. The bean plot shows the distribution of interkinetochore distances for which each localization type was scored. Lines within the beans represent individual cells. Beans for small sets of cells (N < 6) are not shown. The horizontal line represents the mean. (H–J) Sgo1 is required for the maintenance of PP2ARts1, condensin, and the CPC at the centromere. Wild-type and sgo1-aid strains carrying RTS1-3PK (H), BRN1-6HA (I), or IPL1-6HA (J) and a no tag control were arrested in metaphase by treatment with nocodazole for 2 h, and one-third of the culture was harvested. The remaining culture was split, half was treated with NAA to induce Sgo1-aid degradation, and both treated and untreated cultures were harvested after a further 1 h in the presence of nocodazole. Anti-aid, anti-Pgk1, and anti-PK (H) or anti-HA (I,J) immunoblots are shown to confirm Sgo1-aid degradation. Pgk1 is shown as a loading control. Also shown are the mean results of qPCR after anti-PK (H) or anti-HA ChIP (I,J) from four experimental replicates, with error bars representing standard error. The two-tailed paired Student’s t-test was used to calculate significance. (*) P < 0.05. (K) Schematic diagram summarizing disassembly of the pericentromeric signaling platform.

