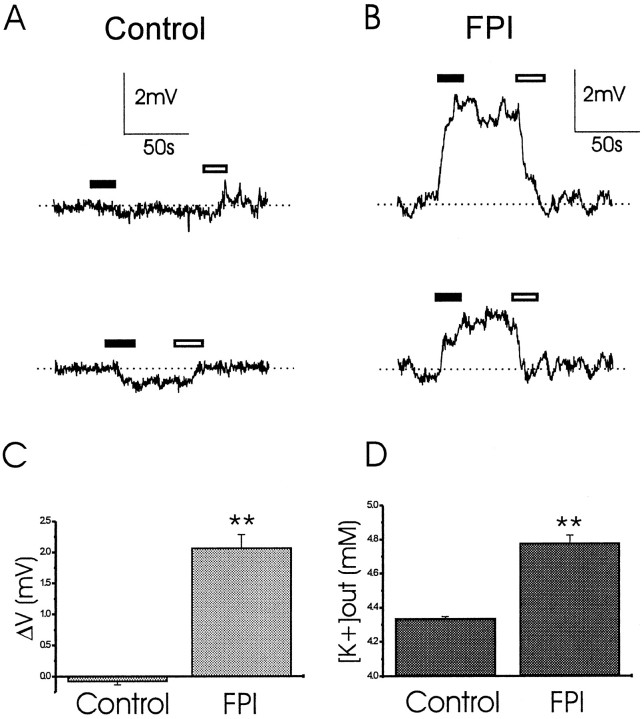
Fig. 6.
CA3 basal [K+]outis elevated after midline FPI. K+ activity recording in CA3 strata radiatum and pyramidale. The KSM was positioned just above the tissue, and the potential read was zeroed. The electrode was then gently inserted at a depth of ∼150 μm. A, In control slices, we observed either little or no DC shifts of the potential corresponding to little or no changes of potassium activity in the extracellular space of the slices. Top andbottom panels correspond to two experiments from two different slices. B, In post-FPI slices, the insertion of the electrode always elicited positive DC shifts, corresponding to increase of K+ activity. Top andbottom panels correspond to two experiments from two different post-FPI slices. C, The DC shifts in potential recorded were −0.08 ± 0.06 mV in control (n= 12) and 2.06 ± 0.2 mV in post-FPI slices (n= 9; p < 0.01). D, The corresponding basal [K+]out was 4.34 ± 0.01 mm in control slices and 4.78 ± 0.05 mm in post-FPI slices. Black andwhite bars represent duration of electrode insertion and extraction, respectively.

