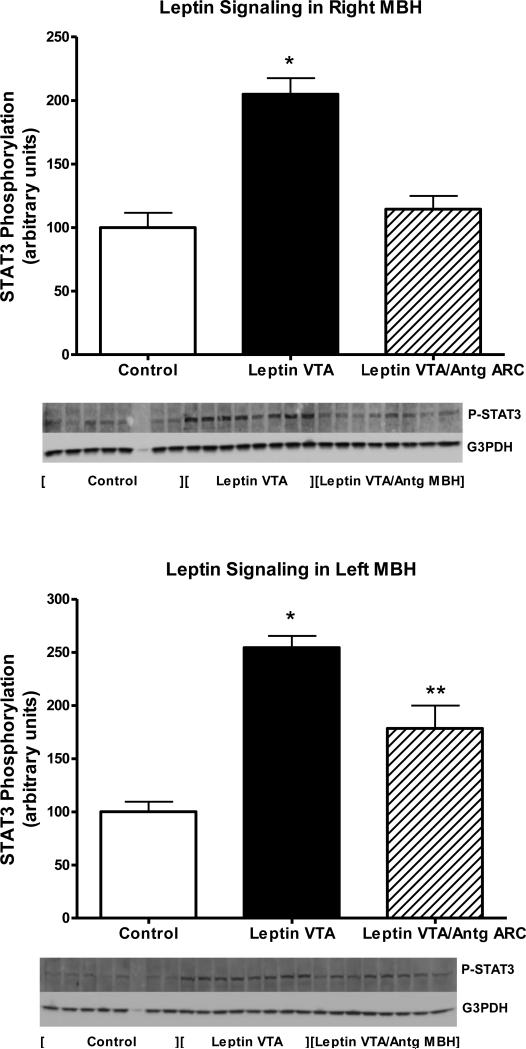
Figure 5.
STAT3 phosphorylation in the right MBH (Top) or left MBH (Bottom) following treatment for 14 days with rAAV-Control vector (open bars), rAAV-Leptin into the VTA (solid bars) or rAAVLeptin VTA /Antg MBH (hatched bars). STAT3 phosphorylation represents that stimulated by leptin gene delivery. No further exogenous leptin was administered. Data is expressed as the ratio of STAT3 Phosphorylation to G3PDH.
Values represent the mean ± SE of 6-8 rats per group. The value of rAAV-Control for each individual tissue is arbitrarily set to 100 with SE adjusted proportionally with remaining groups normalized to the level in rAAV-Control. P< 0.0001 for difference with vector treatment in right MBH (top) and left MBH (bottom) by one-way ANOVA; *P<0.001 for difference between rAAV-Leptin and rAAV-Control by Newman-Keuls post-hoc analysis; **P<0.01 or for difference between leptin VTA /Antg MBH and either control or rAAV-Leptin to VTA by Newman-Keuls post-hoc analysis.

