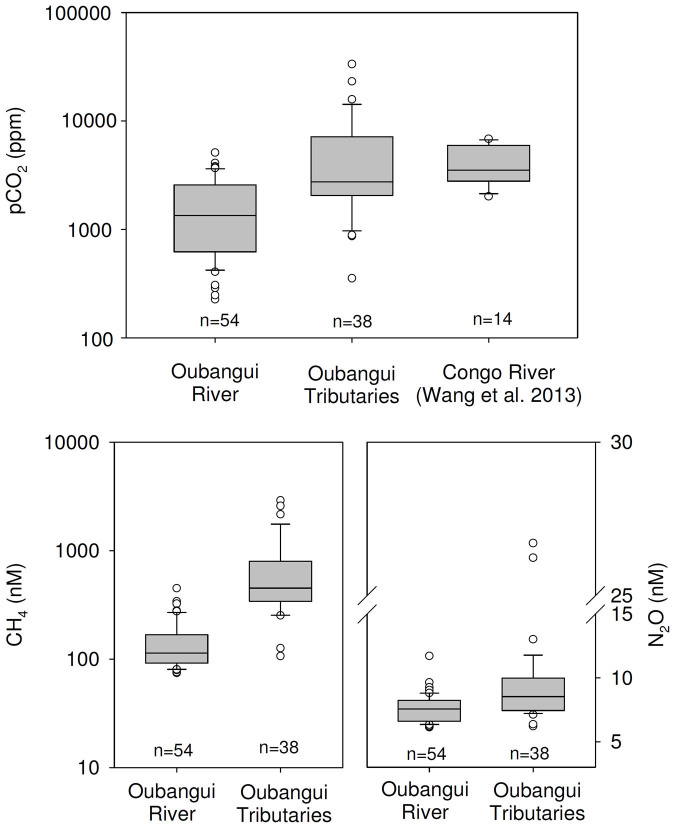
Figure 9. Boxplots of data on pCO2, CH4, and N2O concentrations for the mainstem Oubangui River (data from 2 years of monitoring), and tributaries of the Oubangui (all sites and sampling seasons combined).
pCO2 data for the lower Congo River are from Wang et al. (2013). n indicates the number of data points.

