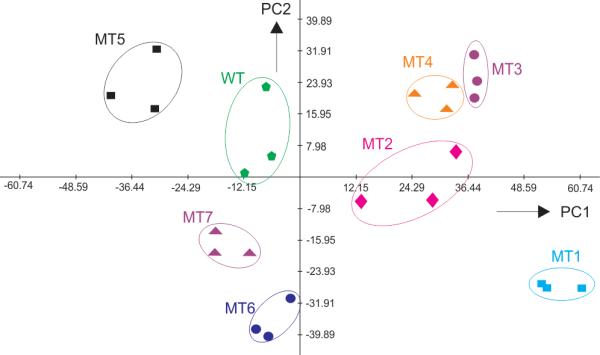
Figure 3.

Principal component analysis (PCA) score plot of the responses from different M.tb analytes in the differential fluorescent receptor (DFR) assay. Clustering of the signals for each analyte in non-overlapping areas indicates the ability of the DFR to differentiate all eight DNA analytes.
