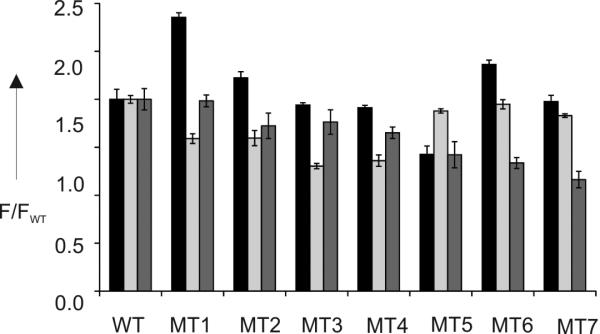
Figure 4.

Fluorescent signatures of eight M.tb DNA analytes produced by the differential fluorescent receptor (DFR) assay. The black, light grey and dark grey bars represent fluorescent signals of Sensors 1, 2, and 3, respectively, divided by the average florescence produced by WT analyte (F/FWT). The data of three independent measurements are shown with standard deviations.
