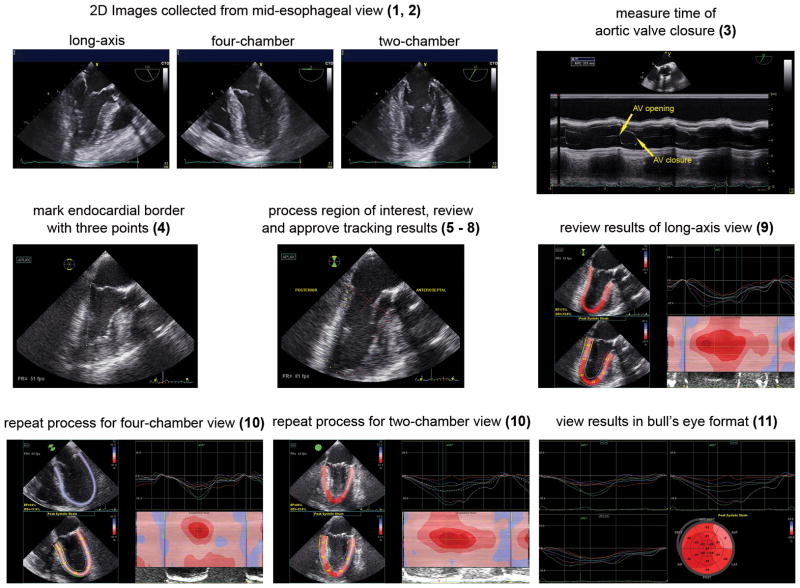
Figure 10.
Acquisition of longitudinal strain using speckle-tracking echocardiography. Optimal 2D mid-esophageal long-axis, four-chamber, and two-chamber images are collected (1, 2). M-mode of the aortic valve determines time of aortic valve closure (3). In the long-axis view, the endocardial border is marked (4). The region of interest is processed, reviewed, and approved by the operator (5–8). Results of strain analysis are reviewed. The strain analysis includes strain curves, peak segmental strain values superimposed on the LV, and a color M-mode display, which demonstrates myocardial deformation over time according to the red-to-blue scale (9). The process is repeated for the four- and two-chamber views (10). LV longitudinal strain values from the three mid-esophageal views are shown in a bull’s eye view (11). The numbers in parenthesis correspond to steps listed in Table 2. “Reprinted with permission, Cleveland Clinic Center for Medical Art & Photography © 2013. All Rights Reserved.”

