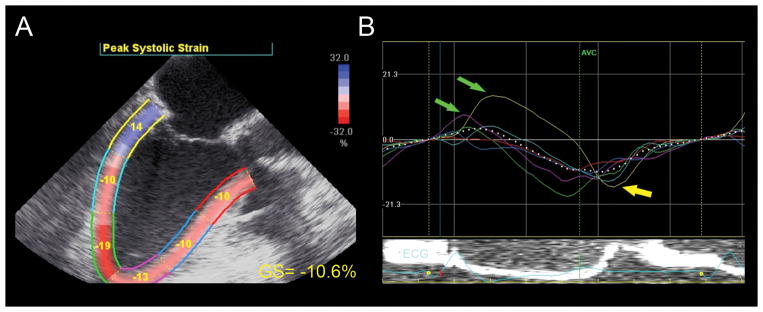
Figure 13.

Strain analysis. (A) This mid-esophageal long-axis view depicts the left ventricle divided into six color-coded myocardial segments. Each segment is labeled with its peak strain measurement. Global longitudinal strain (GS) is abnormal (−10.6%). (B) Post-systolic strain, or “postsystolic shortening” can be seen in the basal (yellow curve) and mid-inferolateral (light blue curve) myocardial wall (yellow arrow). Pre-stretch in the basal inferolateral (yellow) and apical anteroseptal (pink) myocardial region is also seen (green arrows). AVC =aortic valve closure; GS =global strain. “Reprinted with permission, Cleveland Clinic Center for Medical Art & Photography © 2013. All Rights Reserved.”
