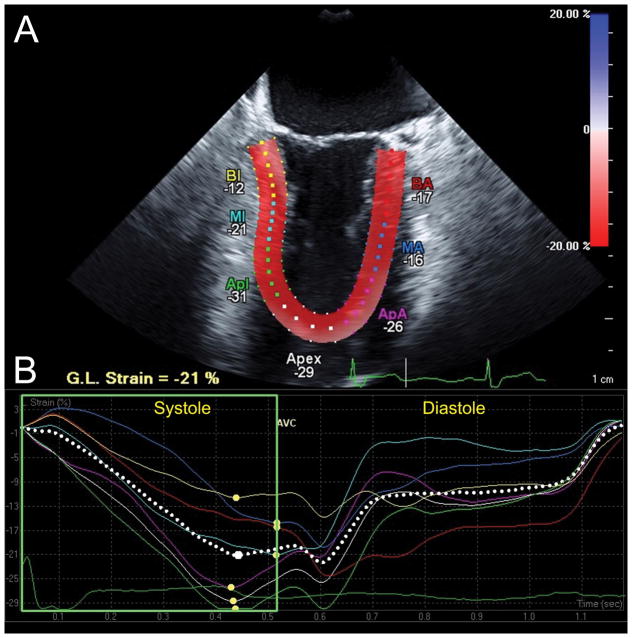
Figure 3.
Longitudinal strain analysis assessed with Cardiac Motion Quantification (CMQ) (Philips Medical Systems, Andover, MA). (A) Mid-esophageal two-chamber echocardiographic view depicting the left ventricle (LV), where the myocardial walls are divided into six segments distinguished by color-coded labels and dots. Segmental strain measurements are shown adjacent to each segment. The myocardium is colored in shades of red corresponding to percent longitudinal shortening (strain) measured by the red-to-blue scale on the upper right-hand side. (B) Longitudinal strain curves, which are color-coded to correspond to myocardial segments in panel A, with time on the X-axis relative to the cardiac cycle and percent shortening (strain) on the Y-axis, demonstrate shortening during systole and returning to baseline at end-diastole. The pink curve, for example, represents the apical anterior wall which experiences peak shortening of −26% during systole (yellow dot identifies peak systolic strain). In contrast, end-systolic strain, measured at time of aortic valve closure (AVC), measures −23%, demonstrating that peak strain may differ from end-systolic strain. The dotted white curve represents global longitudinal strain. BA =Basal anterior; MA =Mid anterior; ApA =Apical anterior, BI =Basal inferior; MI = Mid inferior; Apl =Apical Inferior myocardial walls. G.L. Strain =Global longitudinal strain. AVC =aortic valve closure. “Reprinted with permission, Cleveland Clinic Center for Medical Art & Photography © 2013. All Rights Reserved.”

