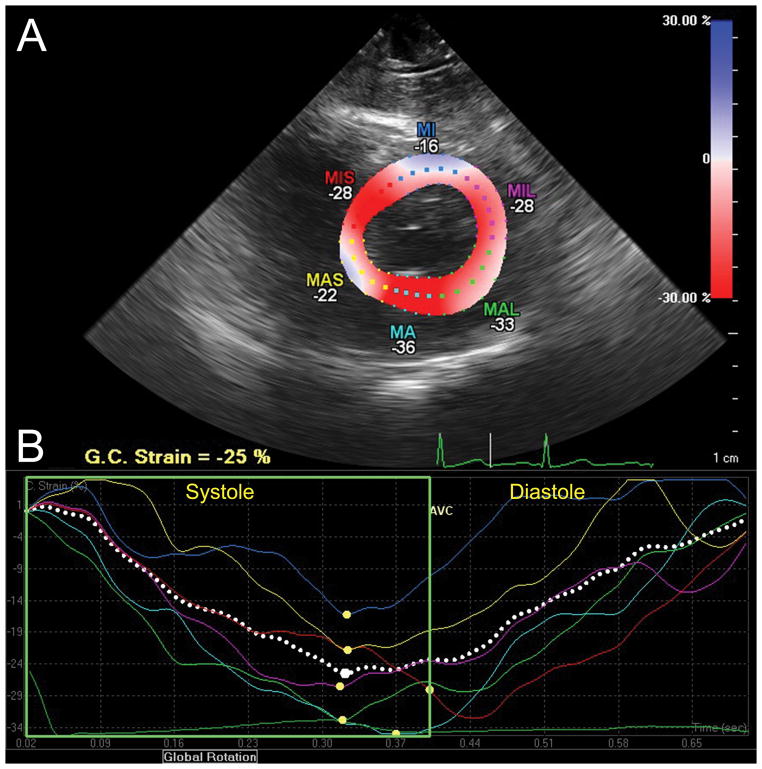
Figure 4.
Circumferential strain analysis assessed with CMQ. (A) This transgastric midpapillary short-axis view of the LV is divided into six segments distinguished by color-coded labels and dots. Segmental strain measurements are shown adjacent to each segment. The myocardium is colored in shades of red-to-blue according to the scale on the right-hand side demonstrating the percent circumferential shortening (strain). (B) Circumferential strain curves, with time on the X-axis and percent shortening (strain) on the Y-axis corresponding to similarly color-coded myocardial segments in panel A, demonstrate shortening during systole and return to baseline at end-diastole. Peak systolic circumferential strain is marked by a yellow dot.
G.C. Strain = Global circumferential strain; MIS =Mid-inferoseptal; MI =mid-inferior; MIL =Mid-inferolateral; MAL =Mid-anterolateral; MA =Mid-anterior; MAS =Mid-anteroseptal wall. “Reprinted with permission, Cleveland Clinic Center for Medical Art & Photography © 2013. All Rights Reserved.”

