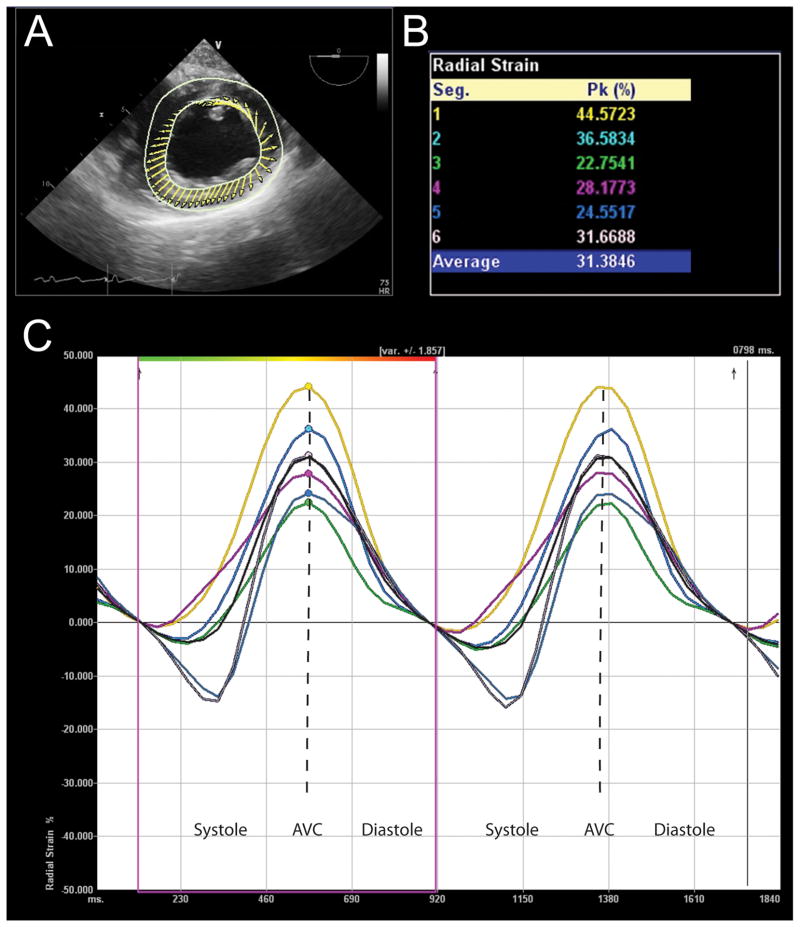
Figure 5.
Radial strain analysis assessed with Velocity Vector Imaging (VVI) (Siemens Medical Solutions, Malvern, PA). (A) This transgastric midpapillary short-axis echocardiographic view depicts the LV, where the direction and relative length of arrows demonstrate direction and amplitude of myocardial velocities. (B) Peak radial strain for six myocardial segments is displayed in this table. (C) Strain curves of two cardiac cycles with time on the X-axis and percent radial strain on the Y-axis. These curves are color-coded to correspond to the myocardial segment described in similarly colored text in Panel B. Peak radial strain is identified with a similarly colored dots. Please note that radial strain is positive since the ventricle thickens in the radial direction.
AVC = aortic valve closure. “Reprinted with permission, Cleveland Clinic Center for Medical Art & Photography © 2013. All Rights Reserved.”

