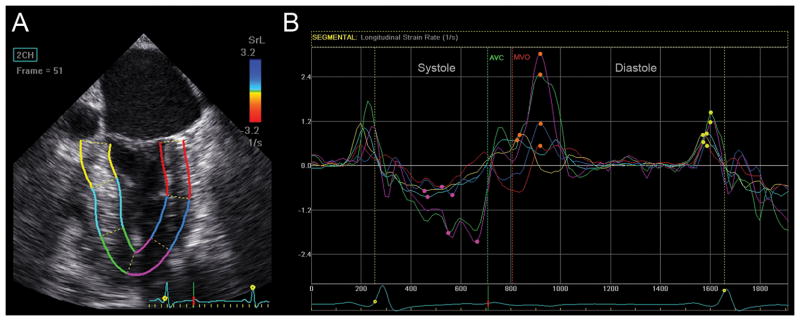
Figure 6.

Strain rate (SR) analyses assessed with EchoPAC (GE Healthcare, Horten, Norway). (A) LV in this mid-esophageal commissural view is divided into six color-coded myocardial segments. (B) Longitudinal SR curves corresponding to similarly colored myocardial segments in panel A are shown. The rate of longitudinal systolic shortening is demonstrated by a negative SR curve. Peak systolic SR is labeled with a pink dot. Following peak systolic SR, the SR curve returns toward zero at time of aortic valve closure (AVC) followed by a biphasic curve during isovolumetric relaxation (between AVC and mitral valve opening (MVO)). Phases of diastole are demonstrated as peak early diastolic SR (SRE), labeled with an orange dot, and late diastolic SR (SRA), corresponding to atrial contraction and marked with a yellow dot. Diastasis, a relatively flat portion of the curve between early and late diastole, has a SR near zero. “Reprinted with permission, Cleveland Clinic Center for Medical Art & Photography © 2013. All Rights Reserved.”
