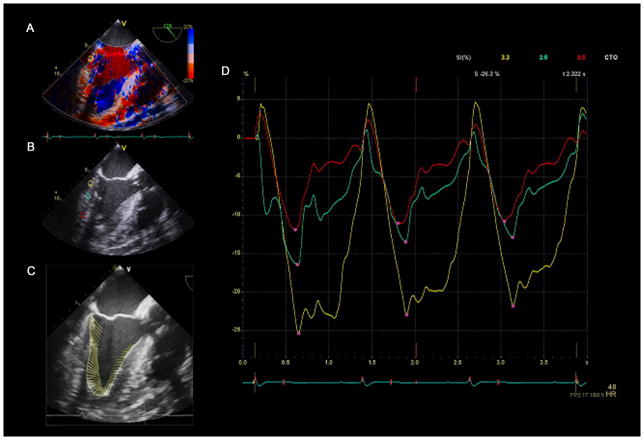
Figure 7.
Tissue Doppler imaging (TDI) strain. (A) A mid-esophageal long-axis view with color tissue Doppler. (B) The operator positions three sample volumes (yellow, aqua, and red circles) within the inferolateral wall to measure TDI strain at each point. (C) Demonstration of the myocardial vector of motion using VVI strain analysis software documents suboptimal alignment with the ultrasound beam. D) Strain curves from the “encircled” region in panel B are shown in the corresponding color. Three cardiac cycles are shown, and peak systolic strain for each region is identified by a pink dot. The “red” sample volume positioned nearest to the apex demonstrates the lowest strain because of poor alignment of the region of interest and vector of motion with the ultrasound beam. “Reprinted with permission, Cleveland Clinic Center for Medical Art & Photography © 2013. All Rights Reserved.”

