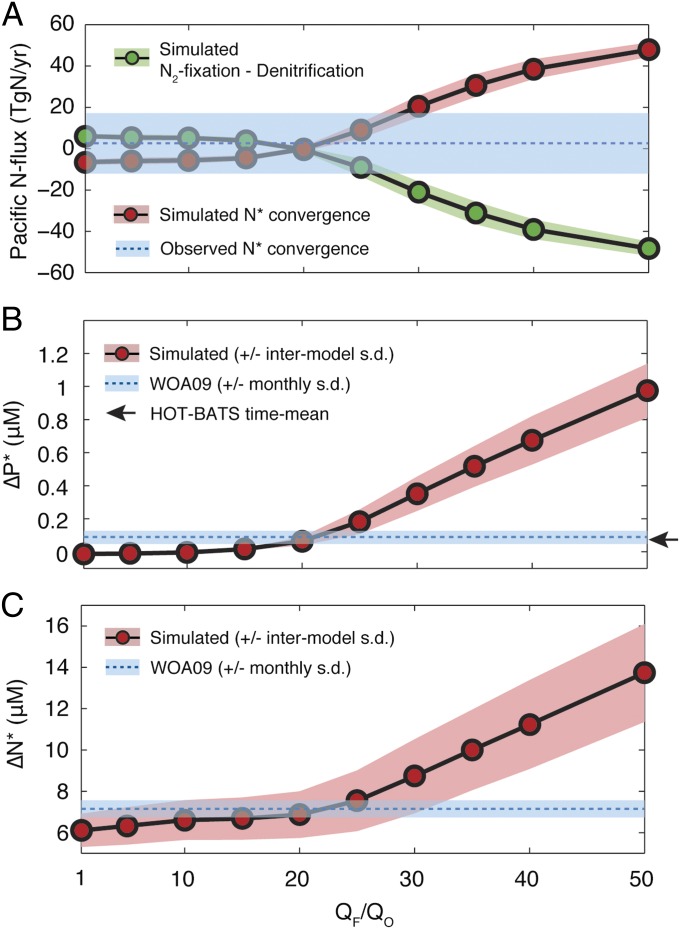
Fig. 2.
Geochemical constraints on Fe limitation regime of the modern ocean. Simulated quantities from model Fe limitation scenarios are compared with observations (blue bars). (A) N budget of the Pacific Ocean: the basin-scale difference between N2 fixation and denitrification (green dots) is balanced by a transport convergence of N* into the basin (red dots). Observational constraint applies to transport component, showing mean and SD of 10,000 Monte Carlo calculations of observed N* convergence into the Pacific (Fig. S4). (B) Difference in surface and (C) difference in thermocline between North Pacific and North Atlantic Subtropical Gyres (; ). Observed values are computed from World Ocean Atlas 2009 annual mean climatology with error envelopes representing SD between months in the monthly climatology. Arrow on B indicates observed P* difference between HOT and BATS locations. In all panels, simulated values and error envelopes represent mean and SD of four benthic denitrification scenarios for each QF/QO.

