Fig. 1.
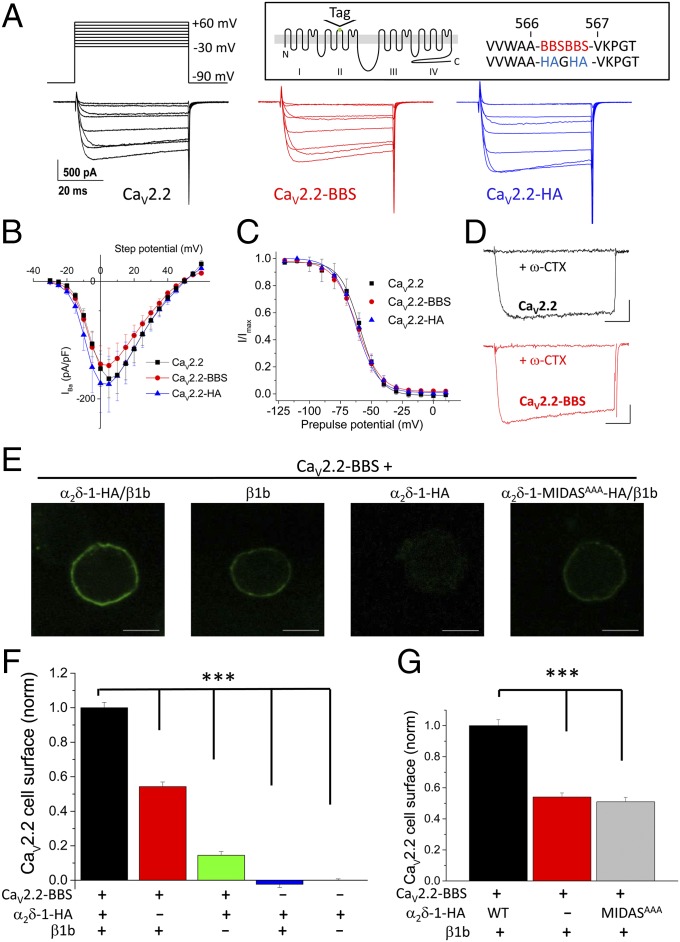
Properties of CaV2.2-HA and CaV2.2-BBS constructs. (A) Examples of IBa currents (the voltage protocol is shown at the top). Data shown are steps between −20 and +50 mV in 10-mV steps, for tsA-201 cells expressing CaV2.2 (Left; black traces), CaV2.2-BBS (Center; red traces), or CaV2.2-HA (Right; blue traces), all with α2δ-1/β1b. (Scale bars refer to all panels.) (Inset) Schematic diagram of CaV2.2 with the location of the tag site (HA and BBS) identified. (B) Mean IV plots for CaV2.2/α2δ-1/β1b (black squares; n = 30), CaV2.2-BBS/α2δ-1/β1b (red circles; n = 17), and CaV2.2-HA/α2δ-1/β1b (blue triangles; n = 13). Individual IV relationships were fit by a modified Boltzmann function. Mean Gmax, V50, act, Vrev, and k values showed no significant differences (Table S1). (C) Mean steady-state inactivation data for CaV2.2/α2δ-1/β1b (black squares; n = 9), CaV2.2-BBS/α2δ-1/β1b (red circles; n = 6), and CaV2.2-HA/α2δ-1/β1b (blue triangles; n = 5). Mean data were fit by Boltzmann functions, with V50, inact values of −59.2, −61.6, and −60.4 mV, respectively. (D) Application of ω-conotoxin GVIA (1 µM for 2 min) produced a complete block of both WT CaV2.2 (Upper; black traces) and CaV2.2-BBS (Lower; red traces) IBa (both representative of n = 5). Currents were elicited by a 50-ms test pulse to +10 mV from −80 mV holding potential. (Scale bars, 200 pA and 10 ms.) Tail current transients have been curtailed for clarity. (E) Representative images showing cell-surface expression of CaV2.2-BBS in Neuro2A cells visualized with α-BTX-AF 488. CaV2.2 +α2δ-1-HA/β1b, +β1b, +α2δ-1-HA, and +α2δ-1-MIDAS-HA/β1b. (Scale bars, 10 μm.) (F) Bar chart of mean (±SEM) cell-surface CaV2.2-BBS density for CaV2.2-BBS/α2δ-1-HA/β1b (black bar; n = 612), CaV2.2-BBS/β1b (red bar; n = 493), CaV2.2-BBS/α2δ-1-HA (green bar; n = 238), α2δ-1-HA/β1b (blue bar; n = 45), and α2δ-1-HA alone (rightmost bar; n = 265). Data are from five separate transfections. Statistical differences were determined by one-way ANOVA and Bonferroni post hoc tests. ***P < 0.001 for CaV2.2-BBS/α2δ-1-HA/β1b compared with all other conditions. Cells were selected that were positive for internal CaV2.2. (G) Bar chart of mean (±SEM) cell-surface CaV2.2-BBS density for CaV2.2-BBS/α2δ-1-HA/β1b (black bar; n = 133), CaV2.2-BBS/β1b (red bar; n = 111), and CaV2.2-BBS/α2δ-1-MIDAS-HA (gray bar; n = 107). Data were obtained from three separate transfections. Statistical differences were determined by one-way ANOVA and Bonferroni post hoc tests. ***P < 0.001 for CaV2.2-BBS/α2δ-1-HA/β1b compared with the other two conditions.

