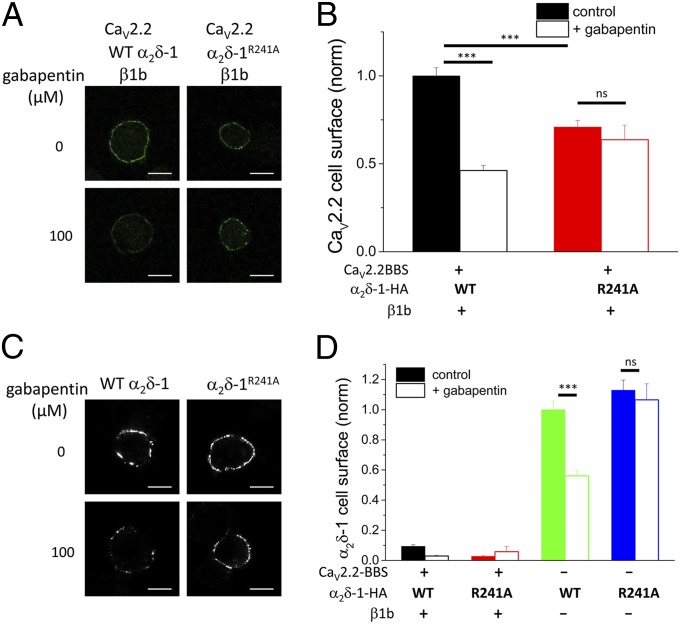
Fig. 4.
Effect of gabapentin on cell-surface expression of CaV2.2 and α2δ-1 and α2δ-1R241A. (A) Cell-surface expression of CaV2.2-BBS in Neuro2A cells transfected with CaV2.2-BBS/α2δ-1-HA (WT)/β1b (Left) or CaV2.2-BBS/α2δ-1R241A-HA/β1b (Right). (Upper) Control cells. (Lower) Cells incubated with gabapentin (100 µM). (Scale bars, 10 μm.) Cells positive for internal CaV2.2 were analyzed. (B) Bar chart of mean (±SEM) cell-surface CaV2.2-BBS density in the absence (solid bars) and presence (open bars) of 100 µM gabapentin, for CaV2.2-BBS/α2δ-1-HA (WT)/β1b (black bars; n = 259, 306) and CaV2.2-BBS/α2δ-1R241A-HA/β1b (red bars; n = 136, 56). Data were obtained from two to four separate transfections. Statistical differences ±gabapentin were determined by Student t test. ***P < 0.001; not significant (ns), P > 0.05. (C) Representative images showing cell-surface expression of α2δ-1-HA (Left) and α2δ-1R241A-HA (Right) in Neuro2A cells transfected with the α2δ-1 subunit alone. (Upper) Control cells. (Lower) Cells incubated with gabapentin (100 µM). (Scale bars, 10 μm.) (D) Bar chart of mean (±SEM) cell-surface α2δ-1-HA density in the absence (solid bars) and presence (open bars) of 100 µM gabapentin for the same experiments quantified in B, with the subunit combinations CaV2.2-BBS/α2δ-1-HA (WT)/β1b (black bars; n = 259, 306), CaV2.2-BBS/α2δ-1R241A-HA/β1b (red bars; n = 136, 56), α2δ-1-HA (WT) (green bars; n = 175, 201), and α2δ-1R241A-HA (blue bars; n = 147, 80). Statistical differences ±gabapentin were determined by Student t test. ***P < 0.001; ns, P > 0.05. Cells were selected that were positive for internal CaV2.2, or α2δ-1 when CaV2.2 was not transfected.

