
Fig. 1.
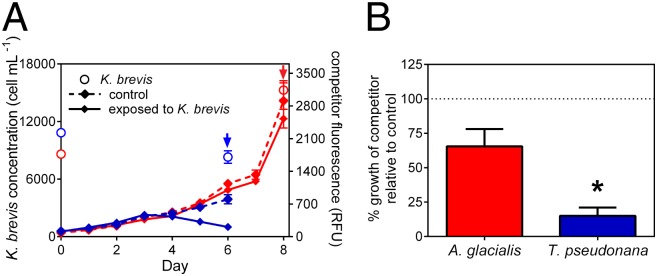
Effects of exposure to exudates of live K. brevis on the growth of A. glacialis and T. pseudonana. (A) A. glacialis (red) in vivo and T. pseudonana (blue) in vivo fluorescence (arrow indicates day of harvest for metabolomics and proteomics). The solid lines indicate fluorescence of diatom-only controls, and the dashed lines indicate fluorescence of diatoms exposed to K. brevis. Initial K. brevis (red open circles for A. glacialis experiment; blue open circle for T. pseudonana experiment) concentrations from cultures used to fill dialysis tubes (n = 1), final concentrations from experimental flasks at time of harvest (n = 15). (B) Calculated percentage growth of competitors A. glacialis (red) and T. pseudonana (blue) relative to their own controls after 8 and 6 d exposure to K. brevis, respectively. The dotted line indicates growth equivalent to control. n = 15. P < 0.0001 indicated by asterisk (*), unpaired t test. Error bars represent ±1 SEM.