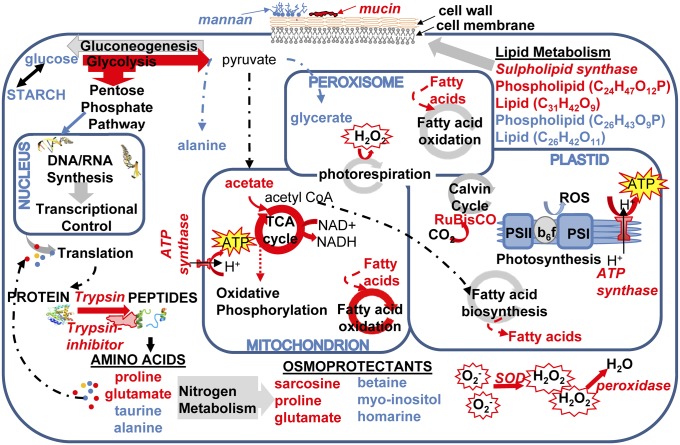
Fig. 3.
Network of cellular pathways, enzymes, and metabolites in the diatom T. pseudonana impacted by exposure to K. brevis allelopathy, derived from NMR and MS metabolomics and proteomics. Pathways and metabolites enhanced by allelopathy are indicated by red arrows and compound names, respectively. The blue arrows and compound names denote pathways and metabolites that were suppressed by allelopathy.

