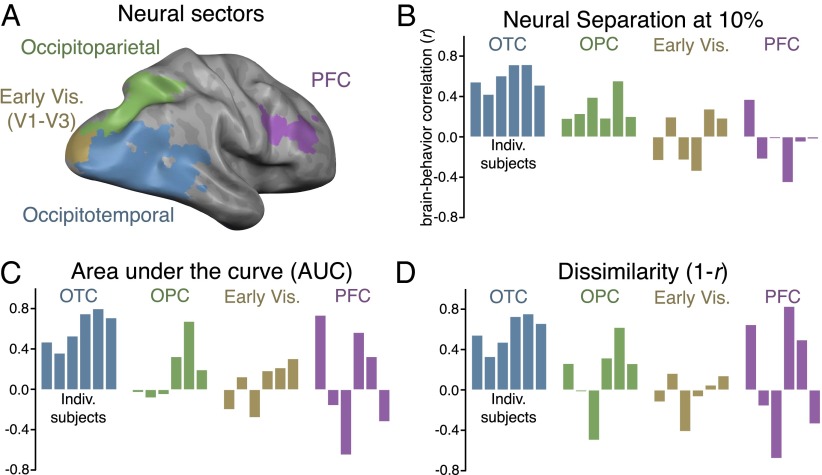
Fig. 4.
(A) Visualization of the four sectors from a representative subject. (B) Brain/behavior correlations in every sector for each fMRI participant at the 10% activation threshold, with r values plotted on the y axis. Each bar corresponds to an individual participant. (C) Brain/behavior correlations in every sector for each participant when using the AUC analysis and (D) representational dissimilarity (1 − r).

