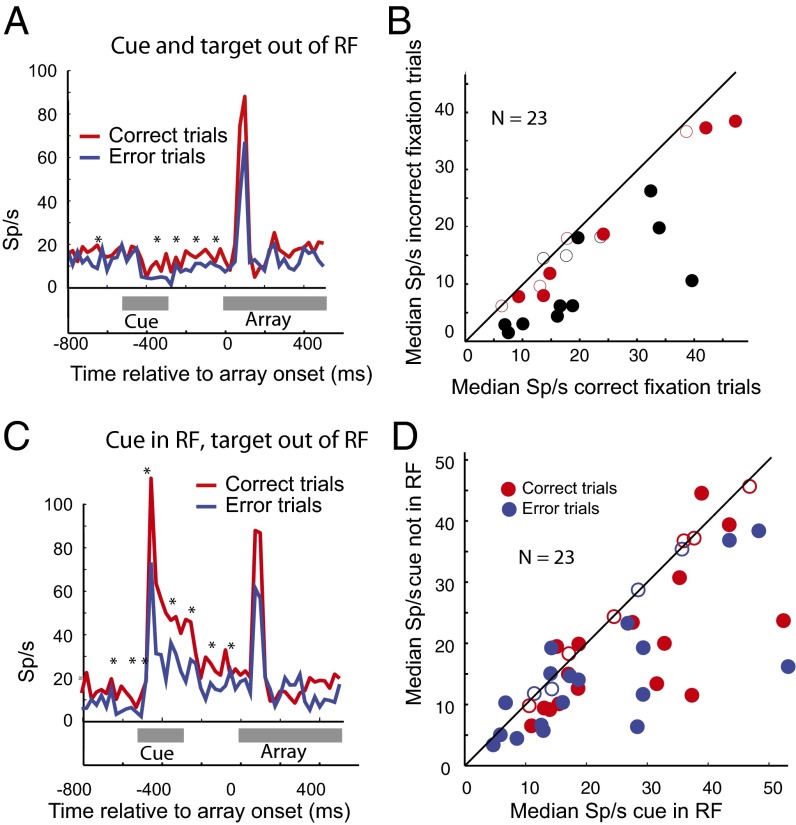
Fig. 4.
Baseline activity in the cued visual attention trials. (A) Activity of a single neuron when the cue and target were out of the receptive field. Poststimulus histograms (25-ms bin width) when the cue (appearing 500–300 ms before array appears, gray line) and target (appearing at 0) appeared outside the receptive field. Asterisks, significant difference (P < 0.05 corrected for multiple comparisons by false discovery rate); red line, correct trials; blue line, incorrect trials. Ordinate, sp/s; abscissa, time relative to array onset. (B) Population activity in the cued visual attention task in fixation trials. Each dot is the median value for a single cell in the interval 300 ms before the array appears; activity in incorrect trials (ordinate) plotted against activity in correct trials (abscissa). Red, monkey T; black, monkey G; closed circles, successful vs. unsuccessful trials statistically different (Mann–Whitney u test, P < 0.05); open circles, successful vs. unsuccessful trials not statistically different. Population difference significant (P < 0.00006, Wilcoxon rank sum). (C) Activity of a single neuron when the cue was in the receptive field but the target outside the receptive field. Same neuron and conventions as in A. (D) Effect of the cue on the baseline activity in fixation trials. Each dot is the median value for a single cell; baseline activity when cue was outside the receptive field (ordinate) plotted against baseline activity when cue was in the receptive field (abscissa). Red dots, successful trials; blue dots, error trials; closed circles, successful vs. unsuccessful trials statistically different (Mann–Whitney u test, P < 0.05); open circles, successful vs. unsuccessful trials not statistically different. Each population is significant (P < 0.05, Wilcoxon rank sum).

