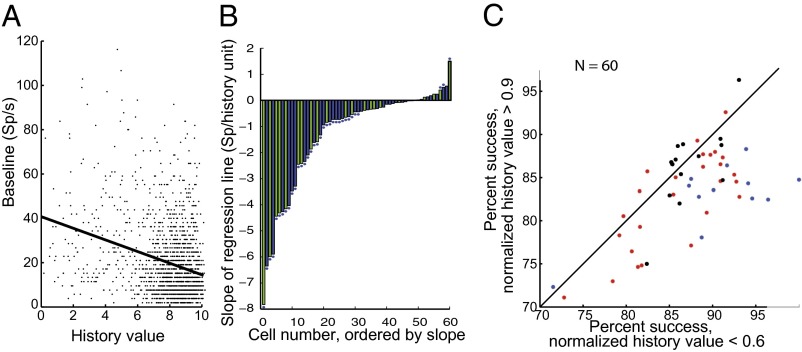
Fig. 5.
Effect of performance history on baseline. (A) Single-cell example of history-slope calculation. Each dot is the mean baseline activity in sp/s in the 500 ms before the array appeared (ordinate), plotted again the history value for that trial (abscissa). Least squares regression, y = −2.6263x + 40.7655, R = 0.3, P < 0.0001. (B) Slopes of every cell in the sample, calculated with tau = 10. Blue bars, standard search task; green bars, cued search task; ordinate, slope for each cell; abscissa, cell number ordered by slope. Asterisks are cells with individual significant slopes (P < 0.05, Spearman rho). (C) History value predicts performance. Each dot is a single cell. Abscissa is the average performance for trials whose history value >0.9; ordinate is the average performance whose history value is <0.6. (P < 0.003, Wilcoxon signed-rank test; history values calculated with tau = 10).

