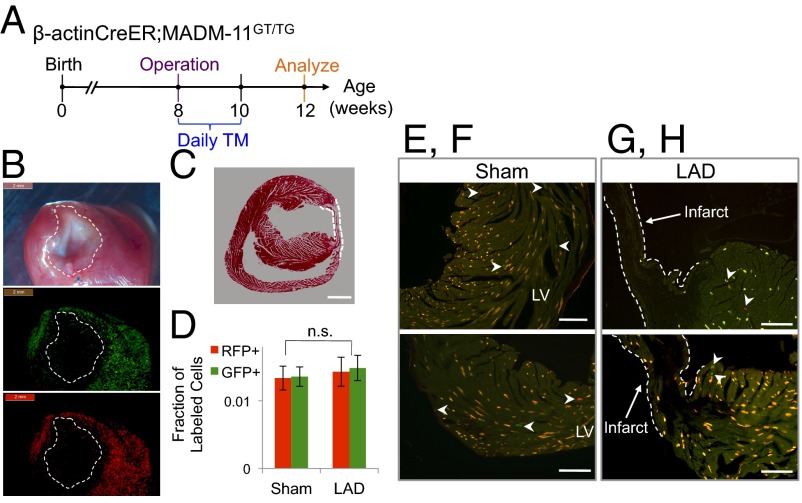
Fig. 4.
Limited birth of new cardiomyocytes after MI in adult mice. (A) Timeline for injury, TM delivery, and analysis of β-actinCreER;MADMGT/TG transgenic mouse model. (B) Gross images of the heart after LAD ligation reveals fibrosis (dashed circle) in the infarct region (Top, phase) and limited infarct and peri-infarct labeling (Middle and Bottom: GFP and RFP channel, respectively). (Scale bars, 2 mm.) (C) H&E section of a MI heart demonstrates an area of fibrosis (within dashed lines). (Scale bar, 150 µm.) (D) Frequency of single-labeled cells is similar between the sham (n = 3) and LAD mice (n = 5). (P values calculated with Student t test. Error bars indicate SEM) (E–H) There are few single-labeled cells (white arrowheads) in the left ventricle (LV) after an MI or sham operation. (Scale bars, 120 µm.)

