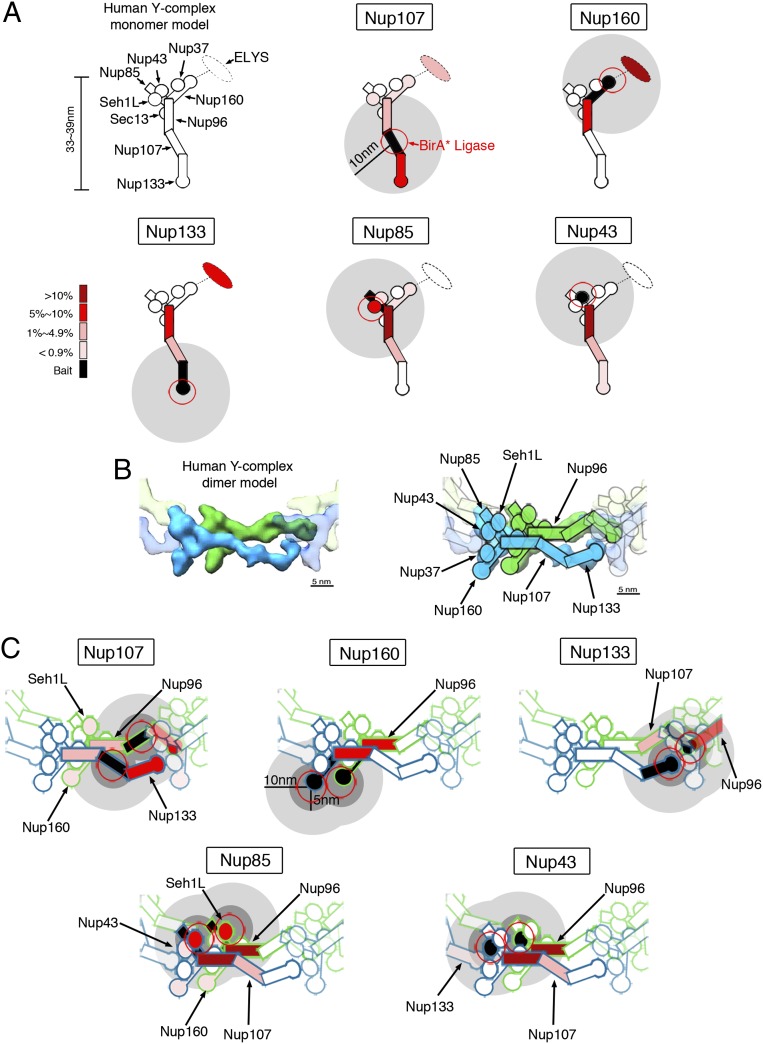
Fig. 5.
Biotinylation of Y-Nups in the context of the whole NPC defines a practical labeling radius. (A) For each BioID-fusion, a model of a single Y-complex subunit is used to depict the relative abundance of Y-Nups detected following BioID pull-down. The red circles depict the approximate position of the BirA* ligase. Gray disks (10-nm radius) provide an approximation of the labeling radius of BioID. (B) Structural model from Bui et al. (21) in which offset Y-complex dimers are arranged in a head-to-tail fashion within the NPC (Left). The approximate positions of Y-Nups are labeled and schematized (Right) on this map. (Modified from ref. 21.) (C) BioID data were applied to the dimer model of Y-complex. The color code in A is used to depict the relative abundance of biotinylated Y-Nups for BioID-fusion proteins. The gray disks (dark: 5-nm radius; light: 10-nm radius) provide an approximation of the labeling radius of BioID.

