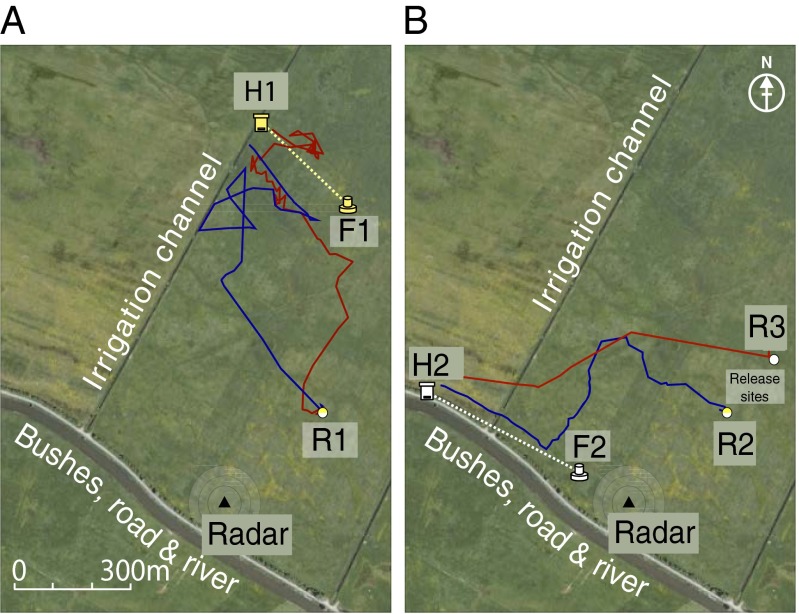
Fig. 2.
Layout of the experimental site. A large flat open field bordered by a row of bushes, a road and a river. Perpendicular to the bushes ran two irrigation channels. Representative bee flights shown. (A) In Exp. 1 bees were trained from hive H1 to the feeder F1 along the yellow dotted line. (B) In Exp. 2 bees were trained from hive H2 to feeder F2 along the white dotted line. The release site in Exp. 1 was R1. In Exp. 2 two release sites were used, R2 and R3. The radar (black triangle at the origin) was positioned ∼60 m from the row of bushes stretching along a small road and a river. H1 is located at the upper part of the western irrigation channel. H2 is located on the edge of the bushes to the south. The blue lines in the figures show representative flight paths from control bees, the red lines from clock-shifted bees.

