Fig. 6.
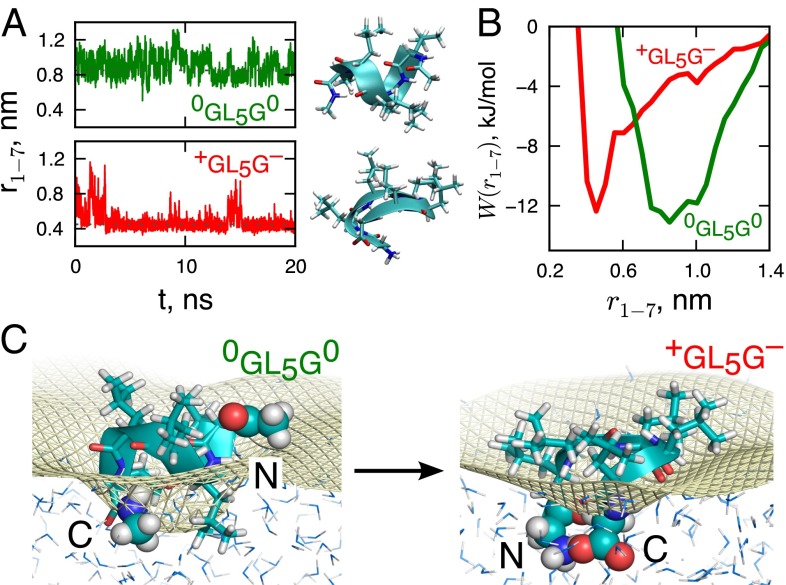
The effect of charging the peptide ends on its structure at the interface. (A) Time dependence of the peptide Cα–Cα end-to-end distance, , over a 20-ns simulation trajectory for the end-neutral and end-charged versions. The representative interfacial conformations of 0GL5G0 (α-helical) and +GL5G− peptides (hairpin turn) obtained using a greedy clustering algorithm (48) are also shown. (B) The PMF along the peptide Cα–Cα end-to-end distance calculated using umbrella sampling simulations. (C) Simulation snapshots of the two versions of the peptide at the water vapor–liquid interface. The peptide backbone (cartoon), the leucine groups (sticks), C and N termini of the peptide (spacefill), and water molecules (oxygen, blue; hydrogen, gray) are shown. The Willard–Chandler instantaneous interface (39) is marked by a yellow mesh.

