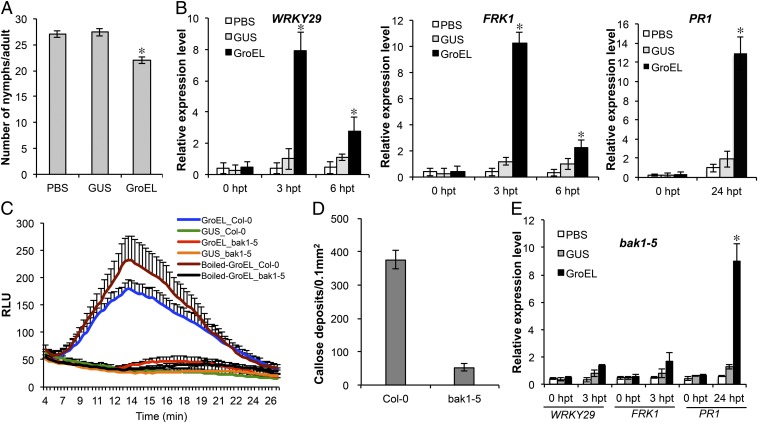
Fig. 4.
GroEL-induced defense responses in Arabidopsis is BAK1-dependent. (A) Green peach aphid fecundity on Col-0 plants infiltrated with PBS (buffer), 1.5 μM GUS (control), or GroEL recorded over a 5 d period. Error bars represent ±SEM (n = 30). * indicates significant differences (ANOVA Tukey HSD test; P < 0.05). (B) Expression of defense marker genes in Col-0 leaves infiltrated with PBS or 1.5 μM GroEL or GUS at the indicated hpt. Error bars represent ±SEM of six biological replicates and two technical replicates. (C) Oxidative burst triggered by 1.5 μM GroEL, boiled GroEL or GUS in Col-0, and bak1-5 leaves measured in relative luminescence units (RLUs). Error bars represent ± SEM (n = 15). (D) Callose deposition in Col-0 and bak1-5 leaves infiltrated with 1.5 μM GroEL. Error bars represent ±SEM (n = 16). (E) Expression of defense marker genes in bak1-5 leaves performed as described for B. For B and E, * indicates significant differences for each gene at a time point (ANOVA Tukey HSD test; P < 0.05).

