Figure 1 .
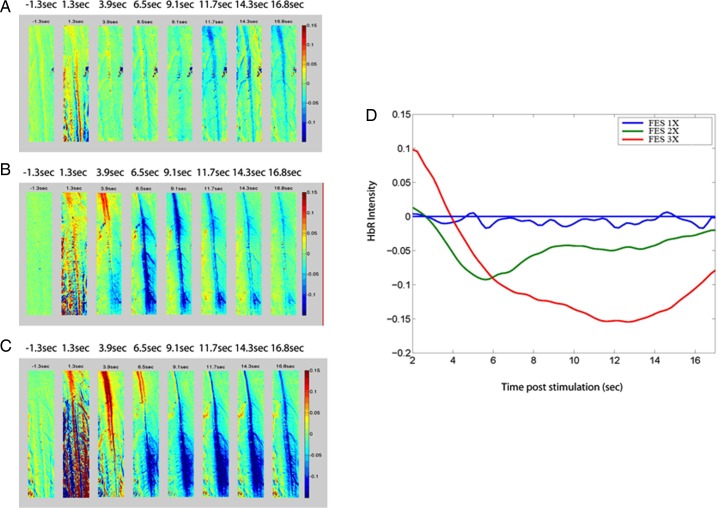
Optical recording of neuronal activation of deoxyhemoglobin (HbR) in the lumbar spinal cord after right hind limb muscle stimulation with the FES apparatus at an intensity of: (A) 1 MT, (B) 2 MT, and (C) 3 MT. (D) Neurovascular activation recorded by intrinsic optical imaging in the spinal cord of a rat in the FES group was proportional to stimulus intensity of 1 MT (blue line), 2 MT (green line), and 3 MT (red line). Control rats showed similar responses between 1 and 3 MT that were similar to those in graph (A) (low amplitude). Note: Since muscle stimulation lasted 2 seconds, the 1.3-second post-stimulus images are not valid, because of spinal cord movement artifacts induced by muscle contraction. Therefore, we removed the first 2 seconds in graph D for clarity.

