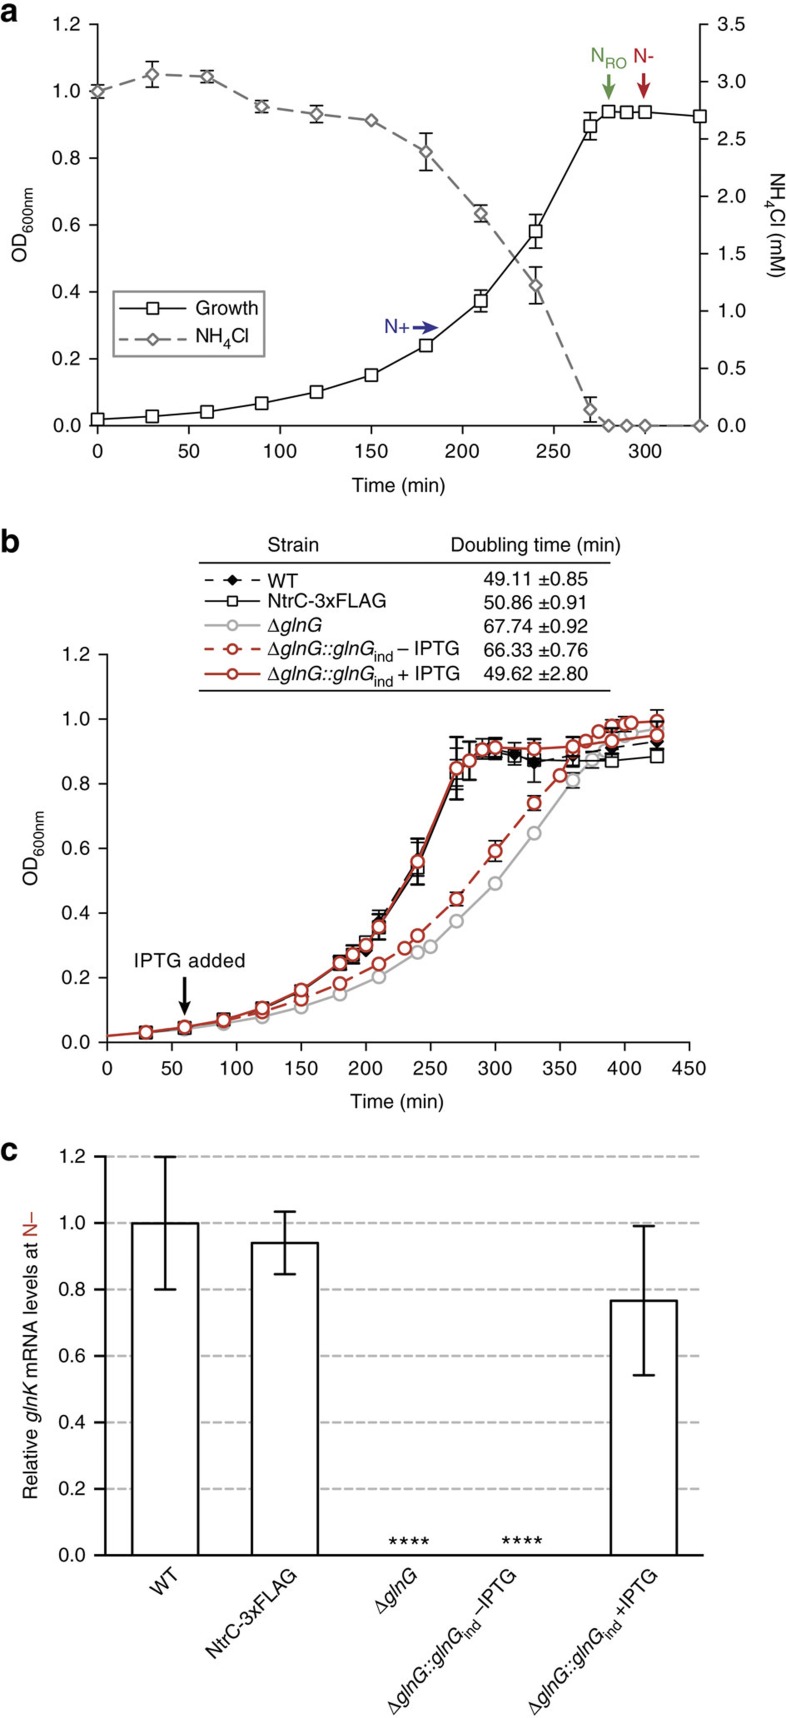
Figure 1. Establishing N-starved growth conditions in E. coli.
(a) The growth arrest of wild-type E. coli NCM3722 cells coincides with ammonium run out (at t=NRO) in the minimal Gutnick medium. The time points at which the E. coli cells were sampled for downstream analysis are indicated (t=N+ and t=N− represents growth under nitrogen replete and starved conditions, respectively). (b) The growth curves of wild-type NCM3722, NCM3722:glnG-FLAG (NtrC-3xFLAG), NCM3722:ΔglnG and NCM3722:ΔglnG::glnGind (−/+ IPTG). The quantitation of the doubling times is also given. (c) Graph showing the relative levels of glnK mRNA expression as fold-change in cells sampled at t=N+ and t=N−. Error bars on all growth curves represent s.d. (where n=3). Statistical significant relationships from One-way ANOVA analysis are denoted (****P<0.0001).

