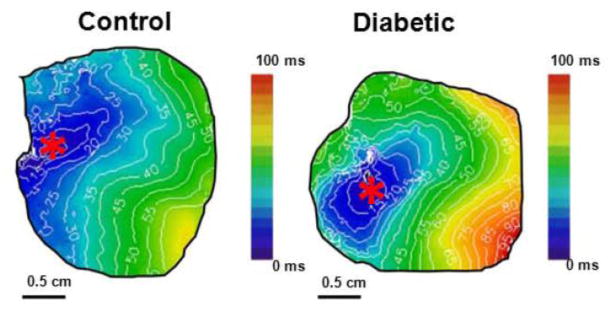
Figure 2. Representative activation maps.

Comparison of representative activation maps of cardiac propagation in control and diabetic hearts in hyperkalemia ([K+]o=12mM) at BCL=250 ms. “*” = pacing site.

Comparison of representative activation maps of cardiac propagation in control and diabetic hearts in hyperkalemia ([K+]o=12mM) at BCL=250 ms. “*” = pacing site.