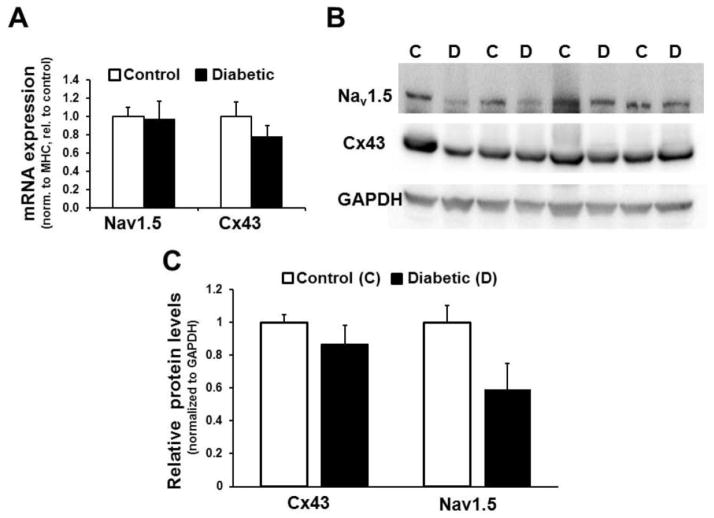
Figure 4. mRNA and protein expression of Nav1.5 and Cx43.
(A.) mRNA Expression levels of Nav1.5, and Cx43 in control vs. diabetic rabbit LV epicardial tissue. N=5 per group. (B.) Immunoblot showing immunodetection of Nav1.5 (Top), Cx43 expression (Middle), and GAPDH (loading control; Bottom) from epicardial left ventricle samples of control (C) and diabetic (D) rabbits. (C.) Densitometric analysis of Cx43 and Nav1.5 expression normalized to GAPDH levels in control and diabetic rabbits. Values represent data (mean ± SEM) from 4 animals in each condition.

