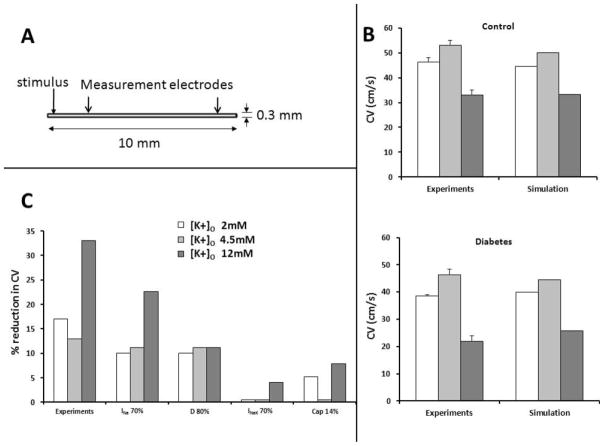
Figure 6. Computer simulations.
(A.) Schematic of 2D model. (B.) Conduction velocity (CV) in simulation vs. experiments in normokalemia, hypokalemia, hyperkalemia in both control and diabetic hearts; diabetes was simulated by reducing the density of INa by 30%. (C.) Reduction in CV when Na+ current magnitude is reduced by 30%, gap junction coupling is reduced by 20%, Na+-K+ pump current is reduced by 30%, and Cm is increased by 14% in the reaction diffusion equation.

