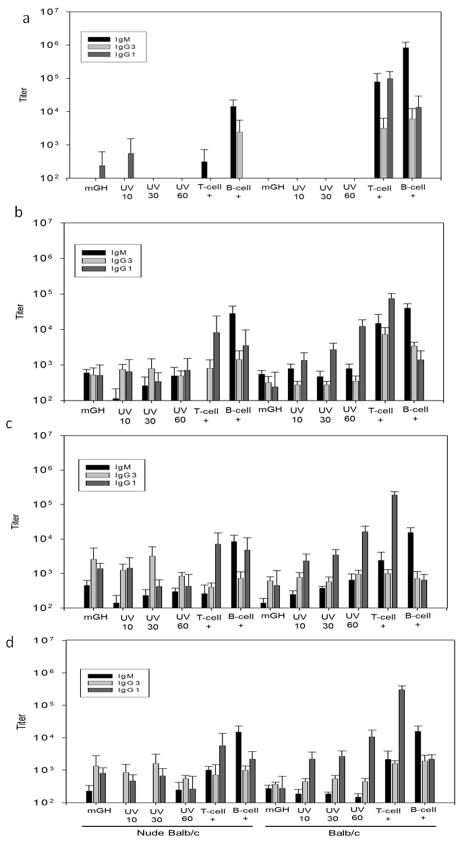
Figure 5.
Antibody responses from day 8 (14a), 22 (14b), 39 (14c) and 50 (14d) sera samples. Each bar is an average of 8 mice. Error bars shown are 95 percent confidence intervals. Bars marked UV 10, UV 30, and UV 60 represent titer for mice injected with mGH exposed to UV radiation for 10, 30, and 60 minutes, respectively. Bars marked “T-cell +” represent titers from mice injected with NP-CGG; bars marked “B-cell +” represent titers for mice injected with NP-Ficoll.

