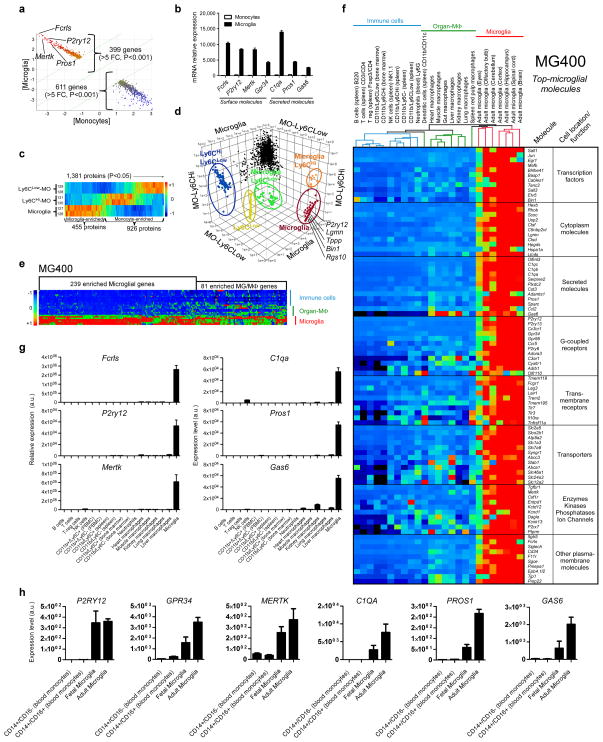
Figure 1. Identification of a microglia signature by gene expression and quantitative mass spectrometry.
(a) AffyExon1 genearray expression profile of adult mouse microglia and splenic Ly6C monocytes (biological triplicates) identified 399 genes in microglia vs. 611 genes in monocytes (>5 fold, P<0.001, Student’s t test, 2-tailed) (see Source data – Figure 1). (b) Gene expression of microglial molecules. Bars show mean normalized intensity ± s.e.m. (n = 3). (c) Heatmap of 1,381 mass spectrometry identified proteins differentially expressed between microglia and Ly6C subsets (ANOVA, P<0.05) (biological duplicates) (see Source data – Figure 1). 455 of these proteins were enriched in microglia and 926 proteins in Ly6C monocytes (see Source data – Figure 1). (d) 3D-scatter plot based on the 1,381 differentially expressed proteins in microglia and monocytes. (e) Heatmap of microglia vs. F4/80+CD11b+ macrophages and immune cells using the MG400 chip. MG, microglia; MΦ, macrophages (see Source data – Figure 1). (f) Heatmap and hierarchical clustering of microglia, macrophages and immune cells analyzed with the MG400 chip (see Source data – Figure 1). Results were log-transformed, normalized and centered, and populations and genes were clustered by Pearson correlation. Data are representative of three different experiments with microglia pooled from 15 mice, macrophages from 10 mice and immune cells pooled from 5 mice. (g) qPCR analysis of identified microglial genes in different cells. Expression levels were normalized to Gapdh (n = 2). Bars show mean ±s.e.m. Shown is one representative of three individual experiments. (h) qPCR validation of the selected 6 microglial genes in both fetal and adult human microglia and human blood-derived monocytes. Expression levels were normalized to Gapdh (n = 2). Bars show mean ± s.e.m.

