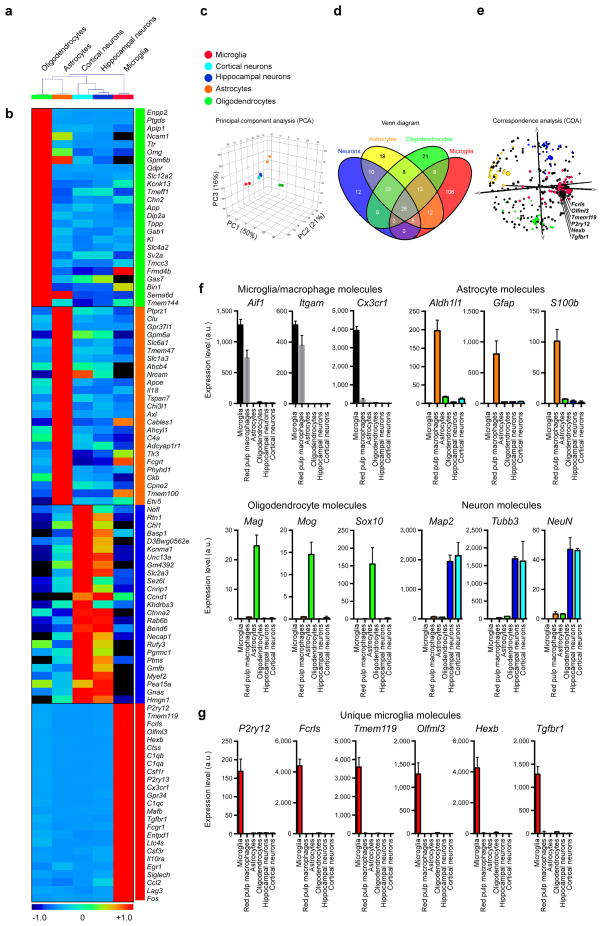
Figure 2. MG400 profile in microglia vs. astrocytes, oligodendrocytes and neurons.
(a) Dendogram of unsupervised hierarchical clustering (Pearson correlation; average linkage) of biological duplicates for FCRLS+ adult microglia (n = 5 mice), Glt-EGFP+ adult astrocytes (n = 9 mice), adult oligodendrocytes (n = 5 mice) and primary postnatal hippocampal and cortical neurons (see Source data – Figure 2). Individual cell types are identified as follows: green, oligodendrocytes; orange, astrocytes; cyan, cortical neurons; dark-blue, hippocampal neurons and red, microglia. (b) Heatmap of top 25 enriched genes in each cell type based on hierarchical clustering. Each lane represents the average expression value of two biological duplicates per cell type. (c) Principle component analysis based on MG400 expression for CNS cells. (d) MG400 profile of detected genes (>100 mRNA transcripts) in microglia, astrocytes, oligodendrocytes and neurons. Venn diagram displays unique and intersecting genes among cell types. (e) Correspondence analysis of samples (large spheres) and genes (small spheres). (f) qPCR analysis of CNS cell type specific genes for each population. (g) qPCR analysis of microglial unique genes (P2ry12, Fcrls, Tmem119, Olfml3, Hexb and Tgfbr1) as compared to spleen red pulp macrophages and CNS cell types. Expression levels were normalized to Gapdh (n = 3). Bars show mean ± s.e.m. Shown is one of two individual experiments.

