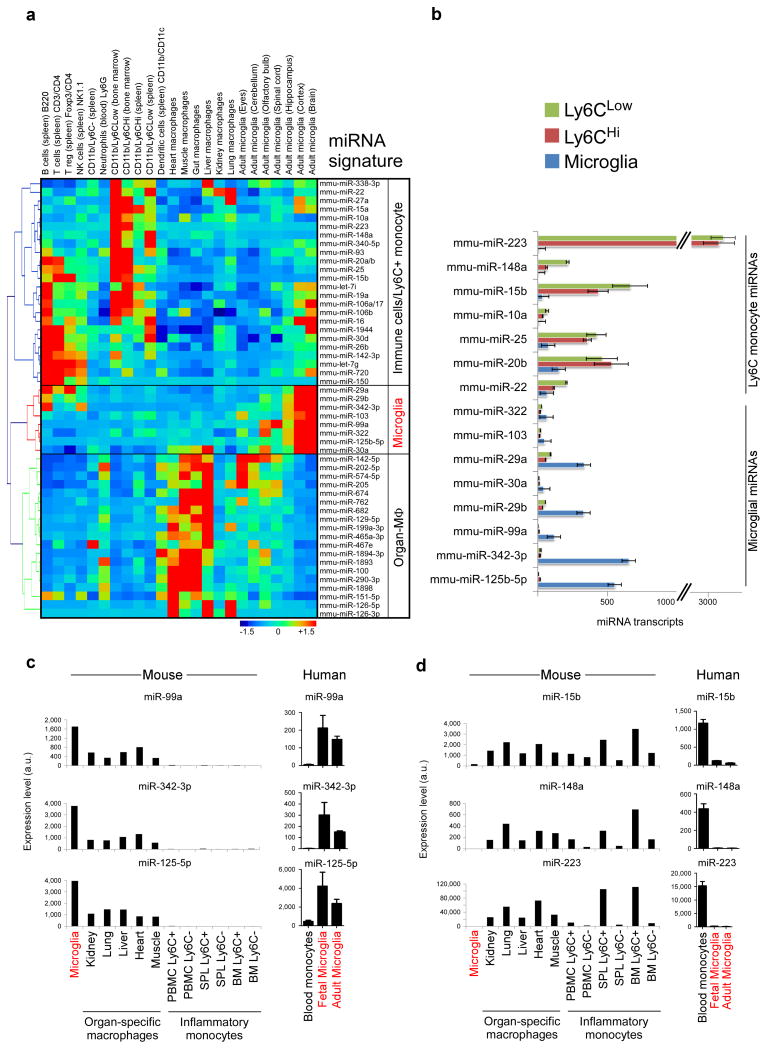
Figure 3. Identification of a miRNA microglia signature.
(a) Heatmap and hierarchical clustering of differentially expressed miRNAs in microglia, organ specific macrophages and immune cell populations based on 600 miRNA nCounter chip (see Source data – Figure 3). (b) miRNA transcript copies of highly expressed microRNAs in microglia and Ly6C monocyte subsets. Bars show mean normalized intensity ± s.e.m. of miRNA transcripts per 100 ng of total RNA (n = 2). (c) qPCR validation of microglial miRNAs (miR-99a, miR-342-3p miR-125b-5p) and (d) inflammatory Ly6C+ miRNAs (miR-15b, miR-148a, miR-223) in Ly6C monocytes, organ-specific macrophages and human fetal and adult microglia. Bars show mean normalized intensity ± s.e.m. (n = 3). miRNA expression level was normalized against U6 miRNA using ΔCt. One representative of two individual experiments is shown.

