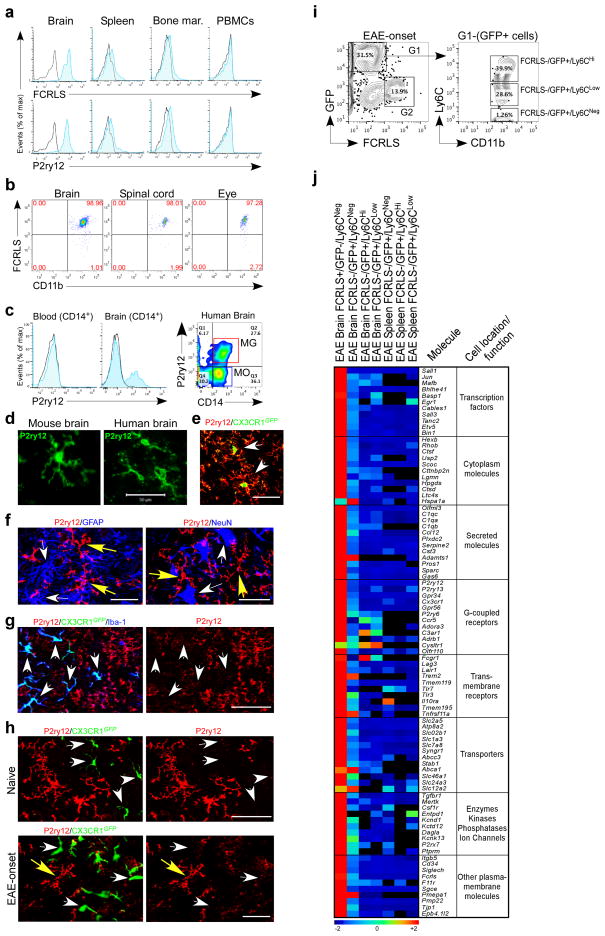
Figure 4. Surface expression of microglial molecules and molecular signature of recruited monocytes during EAE.
(a) FACS analysis of CD11b-gated cells stained with FCRLS and P2ry12 Abs. Black line represents isotype control. Data are representative of three or more replicates. (b) Surface expression of FCRLS in murine brain (n = 6), spinal cord (n = 5) and eye (n = 4) CD11b-gated cells. (c) FACS analysis of P2ry12 expression in human peripheral blood and brain isolated mononuclear cells (n = 3). (d) Immunohistochemistry of cells with microglial morphology stained with anti-P2ry12 Ab in murine (n = 6) and human brain (n = 2). (e) GFP+ microglia in CX3CR1GFP transgenic mouse co-stained with anti-P2ry12 Ab (arrows). (f) Left panel shows staining with P2ry12 and GFAP (astrocyte marker); right panel shows staining with P2ry12 and NeuN (neuronal marker). Yellow arrows point to P2ry12+ microglia. (g) Rat anti-P2ry12 antibody stained Iba-1+GFP− microglia in naïve CX3CR1GFP/+ chimeric mouse but not recruited Iba-1+GFP+ monocytes (arrows). (h) Confocal images of spinal cord from naïve and EAE onset. Resident GFP− microglia are P2ry12 positive. Recruited GFP+ monocytes are P2ry12 negative. Scale bar, 50 μm. (i) FACS sorting of FCRLS+ microglia from EAE chimeric mice at disease onset. Ly6C is expressed by FCRLS−GFP+CD11b+ recruited monocytes (G1). Ly6C is not expressed by FCRLS+GFP−CD11b+ microglia (G2). FACS histogram represents a pool of 5 mice. (j) Heatmap of top microglial genes in sorted microglia, recruited monocytes from brain (n = 6) and splenic monocyte (n = 6) subsets from EAE chimeric mice at disease onset as analyzed by MG400 chip (see Source data – Figure 4). Data represent two independent experiments.

