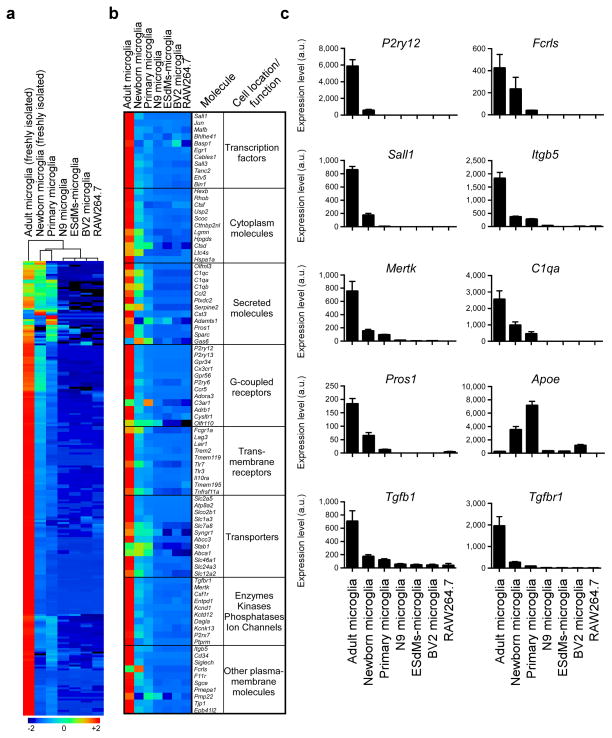
Figure 5. Microglia signature is not present in microglial cell lines.
(a) MG400 expression profile of adult microglia (n = 10), newborn microglia (P1) (n = 30), primary cultured newborn microglia (P1-P2), microglial cell lines (N9, BV2), embryonic stem cell microglia (ESdMs) and RAW264.7 macrophages (see Source data – Figure 5). Data are representative of two different experiments. (b) Heatmap of top microglial genes. One representative of two individual experiments is shown. (c) qPCR analysis of 10 selected microglia genes. Gene expression level was normalized against Gapdh using ΔCt (n = 2). Bars show mean ± s.e.m. Shown is one representative of three individual experiments.

